

Determination of the Best Lactation Curve Model and Lactation Curve Parameters using Different Nonlinear Models for Anatolian Buffaloes


Determination of the Best Lactation Curve Model and Lactation Curve Parameters using Different Nonlinear Models for Anatolian Buffaloes
Ertuğrul Kul*
Department of Animal Science, Faculty of Agriculture, University of Kırşehir Ahi Evran, Kırşehir, Turkey
ABSTRACT
The present investigation was conducted to determine the lactation curve parameters and to choose the best model that defines the lactation curve. Data were composed of 4897 test day milk yield (TDMY) records from Anatolian buffaloes calved during 2014-2017 raised under different farm conditions in Amasya Province, Turkey. Five different lactation curve models such as Wood (WOD), Cobby and Le Du (CLD), Exponential (EXP), Parabolic Exponential (PEXP) and Quadratic (QUA) models were used. The adjusted multiple coefficient of determination (R2adj) and the residual standard deviation (RSD) were evaluated as parameters to detect the best fitted lactation curve model. The results revealed that WOD model described the highest R2adj (0.98) and with the lowest RSD (0.065), besides the highest R2adj (0.97) and the lowest RSD (0.087) were also observed in CLD model. To conclude, WOD and CLD models were detected to be the most suitable models defining the lactation curve of Anatolian buffaloes. As a result, using the parameters detected via WOD and CLD models in breeding studies will contribute significantly to the researches in this direction in these herds.
Article Information
Received 17 May 2019
Revised 27 July 2019
Accepted 07 September 2019
Available online 26 March 2020
Key words
Anatolian buffaloes, Lactation curve, Calving age, Test day milk yield, Nonlinear models
DOI: https://dx.doi.org/10.17582/journal.pjz/20190517090530
* Corresponding author: ertugrul.kul@ahievran.edu.tr
0030-9923/2020/0004-1291 $ 9.00/0
Copyright 2020 Zoological Society of Pakistan
INTRODUCTION
Milk is an important product in dairy farms (Hussain et al., 2018). Daily milk yield during the lactation period follows a curvilinear pattern, therefore a fitted model is necessary for this curve. Lactation curve can provide a valuable knowledge about dairy production (Shinde and Jadhav, 2017). The lactation curve is a graphical representation of milk yield and gives information about the prediction of total milk yield from a single or several test days in the early lactation period. Dairy producer makes better decisions early according to management based on production with such a knowledge (Nasri et al., 2008).
Mathematical models can serve several purposes in herd nutritional management, genetic breeding programs, decision-making on the milk production systems and culling programs to improve animal production (Shinde and Jadhav, 2017). The term lactation curve, which is a graphic representation of the milk yield, enriches characterization of production in the course of lactation, and provides estimation about peak yield and lactation persistency. The knowledge of the lactation curve shape is important for more accurate predictions to study and manage the diary industry. Mathematical modeling of lactation curve by suitable functions widely has been used in the dairy cattle. These functions can also represent a management tool in breeding and selection decisions for buffaloes (Ghavi Hossein-Zadeh, 2016).
Various mathematical models have been developed to describe the lactation curve shape in buffaloes (Wood, 1967; Ali and Schaeffer, 1987; Wilmink, 1987; Guo and Swalve, 1995; Dijkstra et al., 1997). However, the model of best fit has been still elusive due to the influence of various environmental factors. There has been rare information on lactation curve of buffaloes, particularly so in case of Anatolian buffaloes, where different functions were described, and the models of best fit differed (Sahoo et al., 2015).
In this study, lactation curve parameters were determined and by comparing the models used in defining lactation curves the best mathematical models was detected defining the lactation curve of Anatolian buffaloes.
MATERIALS AND METHODS
The test day milk yield (TDMY) records obtained from buffaloes farms in Amasya province where Anatolian buffaloes were kept in. Their cows calved from 2014 to 2017 under different conditions. Amasya province is located in the Mid-Black Sea Region of Turkey with 34° 57’ 06”-36° 31’53” East longitudes, and 41° 04’ 54”-40° 16’ 16” North latitudes. The province has a climate with a transition feature between a Mid Black Sea maritime climates. Long-term average annual temperature varies from 2.7 to 24.1 °C and average relative humidity was 52.5 to 69.4% (MARA, 2015). Buffaloes were kept and fed indoors during the winter and grazed outside from April to December (Kul et al., 2018).
TDMY records were collected during the morning and evening milking once a month in individual farms. The TDMY data known first five or more control yields of buffaloes to define the lactation curves, were obtained. Records of buffaloes with fewer than five test-day records were excluded from the analysis (Torshizi et al., 2011; Şahin et al., 2015). The records pertaining to cull in the middle of lactation, abortion, still-birth or any other pathological causes affecting the lactation yield of the buffaloes were considered as abnormalities and were removed from the dataset. The calving ages were divided into eight sub-groups from three to ten. Then, TDMY records were grouped according to age groups.
Final datasheet comprised of 4897 TDMY records, which consisted of TDMY records of 733 third, 846 fourth, 732 fifth, 757 sixth, 612 seventh, 480 eighth, 354 ninth and 383 tenth year of calving age.
As seen in Table I, five different models were used to estimate the lactation curve parameters.
Table I. Models used to describe the lactation curve.
|
Model |
Functional form |
|
|
Wood |
WOD |
Yt: atb exp (-ct) |
|
Cobby and Le Du |
CLD |
Yt: a- bt-a exp (-ct) |
|
Exponential |
EXP |
Yt: a exp (-ct) |
|
Parabolic Exponential |
PEXP |
Yt: a exp (-bt+ct2) |
|
Quadratic |
QUA |
Yt: a+bt+ct2 |
In the models, Yt = average daily yield in the tth test day of lactation (kg); t = length of time since calving; e is the base of the natural logarithms (Ln); exp is exponential function; a is approximates the initial milk yield after calving; b is the increasing slope parameter up to lactation peak yield, and c is the decreasing slope parameter of lactation curve.
The models were tested for goodness of fit using adjusted coefficient of determination (R2adj), residual standard deviation (RSD).
R2adj was calculated using the following formula:
R2adj = 1 − [(n−1) / (n−p)] × (1−R2)
Where: R2 is the multiple coefficient of determination, [R2 =1−(RSS/TSS)]; RSS is the residual sum of squares, TSS is the total sum of squares, n is the number of observations and p is the number of parameters in the model (Cankaya et al., 2011; Ghavi Hossein-Zadeh, 2014).
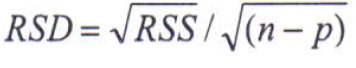
Where; RSS is the residual sum of squares, n is the number of observations and p is the number of parameters in the model (Cankaya et al., 2011; Ghavi Hossein-Zadeh, 2014).
In this study, the most suitable model was identified on the basis of the highest R2adj and RSD. Modelling processing and its estimation were performed by using the Statistica 5.0. V (1995).
RESULTS AND DISCUSSION
The estimated functions of all studied calving ages are reported in Table II. Criteria such as R2adj and RSD were used to evaluate and compare the goodness of fit of these models (Dezfuli and Babaei, 2018). In this study, the WOD and CLD models had higher R2adj and lower RSD value compared to EXP, PEXP and QUA models (Table II). Results of present study indicated that WOD and CLD models were more appropriate models for explaining the properties of milk yield in all calving ages. Although R2adj value for PEXP model was high (0.94), RSD value (0.141) was higher than WOD and CLD models. The R2adj and RSD values for WOD and CLD models were determined as 0.98 and 0.065; 0.97 and 0.087, respectively. Nearly same R2adj value for WOD (Catillo et al., 2002; Gantner et al., 2010; Torshizi et al., 2011) and CLD (Soysal et al., 2016) models were determined in different buffalo breeds. In this study, R2adj values for WOD and CLD models were higher than those of Şahin et al. (2014) who determined as 0.932 and 0.931, respectively.
Table II. Mean values (a, b and c), standard errors, R2adj and RSD of lactation parameters for different lactation curves for all calving ages.
|
Models |
a |
sx |
b |
sx |
c |
sx |
R2adj |
RSD |
|
WOD |
5.18 |
0.145 |
0.88 |
0.073 |
0.36 |
0.023 |
0.98 |
0.065 |
|
CLD |
6.86 |
0.367 |
0.63 |
0.058 |
0.99 |
0.110 |
0.97 |
0.087 |
|
EXP |
5.14 |
0.089 |
0.069 |
0.032 |
0.61 |
0.313 |
||
|
PEXP |
3.26 |
0.349 |
-0.22 |
0.060 |
-0.04 |
0.007 |
0.94 |
0.141 |
|
QUA |
3.66 |
0.0581 |
0.50 |
0.296 |
-0.09 |
0.032 |
0.88 |
0.208 |
R2adj: Adjusted multiple coefficient of determination, RSD: Residual standard deviation.
The results of the current study are in agreement with those of Aziz et al. (2006) and Abdel-Salam et al. (2011) reported WOD model provided the best fit of lactation curve. Also, in the study by Barbosa et al. (2007) on Murrah, Mediterranean and Jafarabadi in Brazil, WOD model has been reported as an appropriate model among Linear (LIN), QUA, Logarithmic (LOG), EXP, Inverse Polynomial (IPOL) and Incomplete Gamma Functions (IGF). In accordance with this finding, Soysal et al. (2016) concluded that WOD model was determined the highest R2adj than Wilmink (WIL) and CLD models. Wood (1967) stressed that WOD model has been used in most lactation curve model studies because of including the main traits of lactation curves with only three parameters allowed the calculation of some key measurements, such as average and maximum production and day to maximum production.
These results were opposed to those of Dijkstra et al. (1997) who found that Dijkstra (DIJK) model fitted better than WOD model. A different result was reported by Gürcan et al. (2011) who found that Logarithmic Quadratic (LQUA) model is the most fitted model for defining lactation curve compared to QUA, Logaritmic Linear (LLIN), Linear Hyperbolic (LHYP) and WIL models. On contrary to these results, in a study conducted on Murrah buffaloes (Fraga et al., 2003), WOD, Multiple Regression (MREG), LQUA and LHYP models were compared, and it was determined that the LQUA function was the best model. Also, some researches (Sherchand et al., 1995; Landete-Castillejos and Gallego, 2000) determined that QUA model was the fitted model to estimate the lactation curves. Şahin et al. (2014) reported that LQUA and QUA models were the best fitted better model models due to the highest R2adj and the lowest RSD. One of the main differences between this and previous studies is the frequency of measurement (Nasri et al., 2008).
The estimated functions of the studied lactation curves (the third to the tenth age groups) with comparable criteria are reported in Table III. According to the results, although lower R2adj were determined for WOD, CLD, EXP and QUA models in the third and fourth age groups, it was found to be the higher R2adj in fifth to tenth age groups. On the contrary of these four functions, PEXP model showed the worst fitting for the third calving age. The RSD was the highest for only WOD and CLD models in third and fourth age groups, but do not differ for EXP, PEXP and QUA values in all age groups. So that, the studied models were do not fitting from the third to the fourth age groups and the best describing performance were obtained for elder age groups. Based on the results, fitted curves from fifth to tenth age groups using WOD and CLD models had largest R2adj and lowest RSD. The shape of the lactation curve was influenced by age groups. Ghavi Hossein-Zadeh (2016) reported that the DIJK model provided the best fit of milk yield for the first three parities of buffaloes due to the lower RSD. In Italy, Catillo et al. (2002) examined the lactation records by using WOD, Reverse Polynomial (RPOL), Exponential Log (ELOG), Polynomial Regression (PREG) model in buffaloes, and reported that the adaptation of all mathematical functions with the lactation curve was very high. Differences between the lactation curve characteristics of buffaloes with different age groups were likely to the differences between goodness of fit of the models for the different calving ages. Also, the difference between fit of models may occur due to the variations in mathematical functions of the models (Ghavi Hossein-Zadeh, 2016). Graphical presentation of observed and predicted TDMY for the five models are illustrated in Figure 1.
Various lactation curve parameters (a, b and c) were calculated to fit into the five models (WOD, CLD, EXP, PEXP and QUA) to obtain the prediction for milk yield (Table III). Where, a is the initial milk yield after calving, b is the ascending slope parameter up to the peak yield, and c is the descending slope parameter (Şahin et al., 2015). Among the studied functions, based on the results, CLD and WOD had the highest a, b and c values. The results revealed that a, b and c values for the WOD and CLD models steadily increased until eight calving age and determined the highest in eighth lactations compared to early lactations. As expected, the younger calving ages of buffaloes had lower milk yield than elder calving ages of buffaloes. This might be explained by the fact that the increasing milk yield in milk secretary tissue increased with age, reaching its maximum value at physiological maturity. Also, Ghavi Hossein-Zadeh (2016) stressed that buffaloes could be selected based on their peak yield, because buffaloes with high daily milk yield at peak can produce more total milk yield over the lactation. Nasri et al. (2008) reported that the goodness of fit for cows of parities 2 and 3 were similar. Scott et al. (1996) pointed out that there was not any difference among lactation curves of multiparous cows. This result is in contrast to Dijkstra et al. (1997) who stressed that greater persistency was determined for cows in their first parity compared to later parities. In this study, values related to the parameter determined by different age groups were found to be different from previous studies. This may be due to the fact that the TDMY of the buffaloes used in the researches are different and the inspection intervals are different.
The parameters a, b and c were generally compatible with the previous literature. This indicates that the lactation curves of the Anatolian buffaloes are typical.
In this study, the number of runs of sign tended to increase with all equations as calving age increased, which means the equations were able to fit lactation records of elder buffaloes better than younger buffaloes (Nasri et al., 2008). Shokrollahi and Hasanpur (2014) stressed that milk production increased until the middle age and decreased afterward. According to Dijkstra et al. (1997), this is due to underdeveloped udder and hence lower alveoli activity at younger age. Differences between the characteristics of the lactation curve of younger and elder buffaloes are likely to be responsible for the difference between goodness of fit of the equations for the different ages (Nasri et al., 2008). Because younger buffaloes are more persistent, their lactation curves are flatter than those of elder buffaloes (Wood, 1967).
Table III. Mean values (a, b and c), standard errors, R2adj and RSD of lactation parameters for different calving ages from three to ten.
|
Calving Age |
Models |
a |
sx |
b |
sx |
c |
sx |
R2adj |
RSD |
|
Three |
WOD |
4.23 |
0.29 |
0.53 |
0.17 |
0.18 |
0.05 |
0.86 |
0.166 |
|
CLD |
5.54 |
0.52 |
0.30 |
0.09 |
1.16 |
0.26 |
0.81 |
0.150 |
|
|
EXP |
4.37 |
0.03 |
- |
- |
0.43 |
0.02 |
0.23 |
0.241 |
|
|
PEXP |
3.34 |
0.49 |
-0.14 |
0.08 |
-0.02 |
0.001 |
0.64 |
0.212 |
|
|
QUA |
3.28 |
0.56 |
0.055 |
0.28 |
-0.07 |
0.03 |
0.65 |
0.200 |
|
|
Four |
WOD |
4.74 |
0.261 |
0.57 |
0.137 |
0.22 |
0.041 |
0.89 |
0.136 |
|
CLD |
5.94 |
0.416 |
0.39 |
0.069 |
1.21 |
0.211 |
0.91 |
0.122 |
|
|
EXP |
4.80 |
0.050 |
- |
- |
0.049 |
0.022 |
0.48 |
0.245 |
|
|
PEXP |
3.75 |
0.565 |
-0.11 |
0.080 |
-0.02 |
0.099 |
0.93 |
0.216 |
|
|
QUA |
3.90 |
0.655 |
0.032 |
0.334 |
-0.06 |
0.036 |
0.68 |
0.240 |
|
|
Five |
WOD |
4.98 |
0.165 |
0.75 |
0.086 |
0.31 |
0.027 |
0.98 |
0.076 |
|
CLD |
6.22 |
0.341 |
0.53 |
0.056 |
1.13 |
0.144 |
0.97 |
0.094 |
|
|
EXP |
4.94 |
0.084 |
- |
- |
0.058 |
0.027 |
0.64 |
0.267 |
|
|
PEXP |
3.43 |
0.421 |
-0.17 |
0.068 |
-0.03 |
0.008 |
0.91 |
0.161 |
|
|
QUA |
3.77 |
0.578 |
0.034 |
0.295 |
-0.07 |
0.032 |
0.85 |
0.207 |
|
|
Six |
WOD |
5.00 |
0.163 |
0.87 |
0.084 |
0.34 |
0.026 |
0.96 |
0.074 |
|
CLD |
6.70 |
0.420 |
0.60 |
0.066 |
0.98 |
0.127 |
0.97 |
0.099 |
|
|
EXP |
4.98 |
0.663 |
- |
- |
0.08 |
0.031 |
0.57 |
0.309 |
|
|
PEXP |
3.22 |
0.406 |
-0.22 |
0.070 |
-0.04 |
0.008 |
0.91 |
0.164 |
|
|
QUA |
3.57 |
0.624 |
0.050 |
0.316 |
-0.09 |
0.034 |
0.85 |
0.223 |
|
|
Seven |
WOD |
4.93 |
0.214 |
0.53 |
0.109 |
0.22 |
0.033 |
0.94 |
0.110 |
|
CLD |
5.93 |
0.332 |
0.41 |
0.056 |
1.31 |
0.197 |
0.94 |
0.105 |
|
|
EXP |
4.93 |
0.449 |
- |
- |
0.06 |
0.020 |
0.61 |
0.221 |
|
|
PEXP |
3.89 |
0.480 |
0.10 |
0.067 |
0.02 |
0.008 |
0.83 |
0.178 |
|
|
QUA |
4.09 |
0.560 |
0.025 |
0.285 |
-0.06 |
0.031 |
0.79 |
0.205 |
|
|
Eight |
WOD |
5.70 |
0.357 |
0.94 |
0.164 |
0.39 |
0.052 |
0.95 |
0.155 |
|
CLD |
7.31 |
0.779 |
0.70 |
0.124 |
1.01 |
0.229 |
0.93 |
0.178 |
|
|
EXP |
4.57 |
0.817 |
- |
- |
0.10 |
0.036 |
0.60 |
0.366 |
|
|
PEXP |
3.49 |
0.579 |
-0.23 |
0.094 |
-0.04 |
0.012 |
0.89 |
0.230 |
|
|
QUA |
4.10 |
0.861 |
0.042 |
0.439 |
-0.09 |
0.048 |
0.81 |
0.308 |
|
|
Nine |
WOD |
4.88 |
0.186 |
0.55 |
0.097 |
0.24 |
0.030 |
0.96 |
0.087 |
|
CLD |
5.77 |
0.306 |
0.43 |
0.052 |
1.34 |
0.194 |
0.95 |
0.097 |
|
|
EXP |
4.88 |
0.443 |
- |
- |
0.07 |
0.021 |
0.83 |
0.211 |
|
|
PEXP |
3.73 |
0.390 |
-0.11 |
0.657 |
-0.02 |
0.007 |
0.90 |
0.143 |
|
|
QUA |
3.96 |
0.472 |
0.024 |
0.240 |
-0.06 |
0.026 |
0.86 |
0.169 |
|
|
Ten |
WOD |
5.01 |
0.227 |
0.78 |
0.116 |
0.32 |
0.036 |
0.96 |
0.106 |
|
CLD |
6.45 |
0.478 |
0.56 |
0.077 |
1.06 |
0.175 |
0.95 |
0.123 |
|
|
EXP |
4.99 |
0.617 |
- |
- |
0.08 |
0.029 |
0.60 |
0.288 |
|
|
PEXP |
3.37 |
0.446 |
-0.19 |
0.073 |
-0.03 |
0.009 |
0.90 |
0.175 |
|
|
QUA |
3.78 |
0.627 |
0.041 |
0.320 |
-0.08 |
0.035 |
0.84 |
0.225 |
R2adj: Adjusted multiple coefficient of determination, RSD: Residual standard deviation.
CONCLUSION
A lot of factors could be considered when selecting the best fit model to describe the lactation curve of buffaloes. Various models have been used to study lactation in dairy buffaloes, although each models had having advantages and disadvantages. While the key factor is the accuracy of the fit of the model, the possibility of calculating the curve characteristics and the interpretation of the curve’s parameters are also as important. Of the five functions investigated in the present study, based on R2adj and RSD, it can be stated that the WOD and CLD models can be preferred for the lactation curve to production program of Anatolian buffaloes. Also, results showed that there were differences between age groups, so the equations fitted data from elder cows better than younger buffaloes. As a result, it can be evidently declared that the WOD and CLD models can be used as an alternative for prediction of the best fitted lactation curve for early animal evaluation and the reduction of the generation interval in breeding programs of Anatolian buffaloes.
ACKNOWLEDGEMENTS
This research was supported financially by Republic of Turkey, Ministry of Agriculture and Forestry, General Directorate of Agricultural Research and Policies. We would like to thank Aziz Şahin and Amasya Water Buffalo Breeders’ Association for valuable technical assistance.
Statement of conflict of interest
The authors declare no conflict of interest.
REFERENCES
Abdel-Salam, S.A.M., Mekkawy, W., Hafez, Y.M., Zaki, A.A. and Abou-Bakr, S., 2011. Fitting lactation curve of Egyptian buffalo using three different models. Egypt. J. Anim. Prod., 48: 119–133.
Ali, T.E. and Schaeffer, L.R., 1987. Accounting for covariance among test day milk yields in dairy cows. Can. J. Anim. Sci., 67: 637-644. https://doi.org/10.4141/cjas87-067
Aziz, M.A., Shalaby, N.A., El-Shafie, O.M., Mahdy, A.T. and Nishida, A., 2006. Comparison between the shapes of lactation curve of Egyptian buffalo milk yield estimated by the incomplete gamma function and a new model. Livest. Res. Rural Dev., 18: Article #59.
Barbosa, S.B.P., Pereira, R.G.A., Santoro, K.R., Batista, A.M.V. and Neto, R., 2007. Lactation curve of cross-bred buffalo under two production systems in the Amazonian region of Brazil. Ital. J. Anim. Sci., 6: 1075–1078. https://doi.org/10.4081/ijas.2007.s2.1075
Cankaya, S., Ünalan, A. and Soydan, E., 2011. Selection of a mathematical model to describe the lactation curves of Jersey cattle. Arc. Tierz., 54: 27-35. https://doi.org/10.5194/aab-54-27-2011
Catillo, G., Macciotta, N.P.P., Carretta, A. and Cappio-Borlino, A., 2002. Effects of age and calving season on lactation curves of milk production traits in Italian water buffaloes. J. Dairy Sci., 85: 1298–1306. https://doi.org/10.3168/jds.S0022-0302(02)74194-5
Dezfuli, B.T. and Babaei, M., 2018. Fitting five models to describe milk production curve for Khuzestani buffaloes of Iran in different parities and calving seasons. Glob. J. Anim. Sci. Res., 6: 1-10.
Dijkstra, J., France, J., Dhanoa, M.S., Maas, J.A., Hanigan, M.D., Rook, A.J. and Beever, D.E., 1997. A model to describe growth patterns of the mammary gland during pregnancy and lactation. J. Dairy Sci., 80: 2340-2354. https://doi.org/10.3168/jds.S0022-0302(97)76185-X
Fraga, L.M., Gutierrez, M., Fernandez, L., Fundora, O. and Gonzalez, M.E., 2003. Preliminary study of lactation curves in graded Murrah buffaloes. Cuban J. agric. Sci., 37: 149-153.
Gantner, V., Jovanovac, S., Raguz, N., Solic, D. and Kuterovac, K., 2010. Non-linear vs. linear regression models in lactation curve prediction. Bulgarian J. agric. Sci., 16: 794-800.
Ghavi Hossein-Zadeh, N., 2016. Comparison of non-linear models to describe the lactation curves for milk yield and composition in buffaloes (Bubalus bubalis). Animal, 10: 248–261. https://doi.org/10.1017/S1751731115001846
Ghavi Hossein-Zadeh, N., 2014. Comparison of non-linear models to describe the lactation curves of milk yield and composition in Iranian Holsteins. J. Agr. Sci., 152: 309–324. https://doi.org/10.1017/S0021859613000415
Guo, Z., Swalve, H.H., 1995. Modelling of the lactation curve as a sub-model in the evaluation of test day records. Interbull bulletin, Issue. No. 11, Prague, Czech Republic.
Gürcan, E.K., Soysal, M.I., Küçükkebapçı, M., Yüksel, M.A. and Genç, S., 2011. Comparison with different models of lactation curve of buffaloes. 7th National Animal Science Congress, Adana.
Hussain, A., Ahmad, M.U.D., Mushtaq, M.H., Chaudhry, M., Khan, M.S., Reichel, M., Hussain, T., Khan, A., Nisar, M. and Khan, I. A., 2018. Prevalence of overall and teatwise mastitis and effect of herd size in dairy buffaloes. Pakistan J. Zool., 50: 1107-1112.
Kul, E., Filik, G., Şahin, A., Çayıroğlu, H., Uğurlutepe, E. and Erdem, H., 2018. Effects of some environmental factors on birth weight of Anatolian buffalo calves. Turkish J. Agric. Fd. Sci. Technol., 6: 444-446. https://doi.org/10.24925/turjaf.v6i4.444-446.1716
Landete-Castillejos, T. and Gallego, T.L., 2000. Technical note: The ability of mathematical models to describe the shape of lactation curves. J. Anim. Sci., 78: 3010-3013. https://doi.org/10.2527/2000.78123010x
MARA, 2015. The master plan of Amasya province. MARA statistical data of Amasya province. Amasya.
Nasri, M.F., France, J., Odongo, N. E., López, S., Bannink, A. and Kebreab, E., 2008. Modelling the lactation curve of dairy cows using the differentials of growth functions. J. agric. Sci., 146: 633-641. https://doi.org/10.1017/S0021859608008101
Sahoo, S.K., Singh, A., Gupta, A.K., Chakravarty, A.K., Ambhore, G.S. and Dash, S.K., 2015. Comparative evaluation of different lactation curve functions for prediction of bi-monthly test day milk yields in Murrah buffaloes. Anim. Sci., 9: 89-94.
Scott, T.A., Yandell, B., Zepeda, L., Shaver, R.D. and Smith, T.R., 1996. Use of lactation curves for analysis of milk production data. J. Dairy Sci., 79: 1885–1894. https://doi.org/10.3168/jds.S0022-0302(96)76557-8
Sherchand, L., McNew, R.W., Kellogg, D.W. and Johnson, B., 1995. Selection of a mathematical model to generate lactation curves using daily milk yields of Holstein cows. J. Dairy Sci., 78: 2507-2513. https://doi.org/10.3168/jds.S0022-0302(95)76880-1
Shinde, S.D., Jadhav, V.A., 2017. Selection of mathematical models to generate the lactation curves of gir triple cross cattle. Contemp. Res. India, 7: 42-47.
Shokrollahi, B. and Hasanpur, K., 2014. Study of individual lactation patterns of Iranian dairy buffaloes. J. Agric. Rural Dev. Trop. Subtrop., 115: 125–133.
Soysal, M.I., Gurcan, E.K. and Aksel, M., 2016. The comparison of lactation curve with different models in Italian origined water buffalo herd raised in Istanbul province of Turkiye. J. Tekirdag Agric. Fac., 13: 139-144.
Statistica, 1995. Statistica for Windows PC 5.0. Stat Soft. Inc. 2325 East 13th Street, Tulsa, OK74104, USA, 1995.
Şahin, A., Ulutaş, Z., Yıldırım, A., Aksoy, Y. and Genç, S., 2015. Lactation curve and persistency of Anatolian buffaloes. Ital. J. Anim. Sci., 14: 150-157. https://doi.org/10.4081/ijas.2015.3679
Şahin, A., Ulutaş, Z., Yıldırım, A., Yüksel, A. and Genç, S., 2014. Comparison of different lactation curve models of Anatolian buffaloes. Kafkas Univ. Vet. Fak. Derg., 20: 847-855. https://doi.org/10.9775/kvfd.2014.11140
Torshizi, M.E., Aslamenejad, A.A., Nassiri, M.R. and Farhangfar, H., 2011. Comparison and evaluation of mathematical lactation curve functions of Iranian primiparous Holsteins. S. Afr. J. Anim. Sci., 41: 104-115. https://doi.org/10.4314/sajas.v41i2.71013
Wilmink, J.B.M., 1987. Adjustment of test day milk, fat and protein yield for age, season and stage of lactation. Livest. Prod. Sci., 16: 335-348. https://doi.org/10.1016/0301-6226(87)90003-0
Wood, P.D.P., 1967. Algebraic model of lactation curve in cattle. Nature, 216: 164-165. https://doi.org/10.1038/216164a0
To share on other social networks, click on any share button. What are these?


