

Determination of Number and Position of Knots in Cubic Spline Regression for Modeling Individual Lactation Curves in Three Different Breed


Determination of Number and Position of Knots in Cubic Spline Regression for Modeling Individual Lactation Curves in Three Different Breed
Samet Hasan Abaci1,*, Hasan Onder1, Mustafa Sahin2 and Esra Yavuz3
1Ondokuz Mayis University, Faculty of Agriculture, Department of Animal Science, 55139, Samsun, Turkey
2Kahramanmaras Sutcu Imam University, Faculty of Agriculture, Department of Agricultural Biotechnology, 46040, Kahramanmaras, Turkey
3Kahramanmaras Sutcu Imam University, Faculty of Agriculture, Department of Animal Science, 46040, Kahramanmaras, Turkey
ABSTRACT
Lactation curves are one of the basic tools in animal breeding. Therefore, modeling lactation curves with appropriate and precise equations are of great importance for obtaining estimates. Lactation curves have different tendencies in different breeds. To examine the tendencies and differences Jersey (J), Brown Swiss (BS) and Holstein Friesian (HF) breeds which are commonly raised in Turkey were used in this study. This study aimed to statistically determine the optimal position and number of knots in cubic spline regression used for modeling lactation curves. Knots were taken as 60, 90, 120 and 150 days and combinations of them for every breed. To compare the Mean Square Errors (MSE) of the models, the autocorrelation values of Durbin Watson (DW), the information criteria of Akaike (AIC) and the coefficient of determination (R2) were used as comparison criteria. Kruskal Wallis H test was used to compare comparison criteria in different models. The Mann Whitney U test was used to compare the groups in pairs. Results showed that four knots was sufficient for J breed MSE: 0.640 ± 0.0652, DW: 2.272 ± 0.0232, AIC: 16.927 ± 1.0649, R2: 0.982 ± 0.0020) and BS breed (MSE: 0.131 ± 0.0156, DW: 2.326 ± 0.1093, AIC: 3.567 ± 0.9193, R2: 0,985 ± 0.0008), but three knot was sufficient for HF breed (MSE: 1.600 ± 0.132, DW: 2.114 ± 0.020, AIC: 22.596 ± 0.783, R2: 0.972 ± 0.002). As a general result of the study show that four knots (60, 90, 120 and 150 days) for J and BS breeds and three knots (90, 120 and 150 days) for HF breed were sufficient to estimate lactation curve by cubic spline regression model.
Article Information
Received 29 January 2020
Revised 01 March 2020
Accepted 04 March 2020
Available online 17 August 2020
Authors’ Contribution
SHA, HO and MS designed and supervised the work. SHA and EY made statistical analysis. SHA, HO and MS wrote the article.
Key words
Cubic spline, Lactation curve, Jersey, Brown Swiss, Holstein Friesian.
DOI: https://dx.doi.org/10.17582/journal.pjz/20200129080117
* Corresponding author: shabaci37@gmail.com
0030-9923/2020/0006-2039 $ 9.00/0
Copyright 2020 Zoological Society of Pakistan
Introduction
The lactation curve is a graphical presentation of the variations in milk production throughout the lactation period (Papajcsik and Bodero, 1988; White and Brotherstone, 1997; de Groot et al., 2003; Silvestre et al., 2006; Cunha et al., 2010). Lactation curves are one of the basic tools in animal breeding. Therefore, modeling the lactation curves with appropriate and precise equations is of great importance to estimate the milk yield of cows.
Some studies estimate lactation milk yield with different methods (Gantner et al., 2009). It has also been proposed different methods such as Ali Schaeffer, Random Regression, Wood and Wilmink to analyze the periods of lactation (Cankaya et al., 2014; Sahin et al., 2014; Harder et al., 2019; Younesi et al., 2019). In addition, splines are a useful type of function used in regression when the relationship between a response and a set of covariates is not known before (Vargas et al., 2000) to describe the lactation curve of dairy cows.
Splines are generally defined as piecewise polynomials of degree n with function values. Junction points are called knots. Cubic splines are smooth at knots (function, first and second derivatives of agreement). Cubic spline regression, knot points, usually from the internal or external convex near the start or end point are selected. On the other hand, in fitting the cubic spline regression model, the number of knots affects the fit rather than the position of the knots (Lopez-Villalobos et al., 2005; Cankaya et al., 2014). As the number of knots increases, the number of pieces increases. Therefore, increasing the number of knots generally increases the fit of the spline function for the data (White and Brotherstone, 1997; Walker et al., 2010; Cankaya et al., 2014).
Cubic spline regression models have been used to model the lactation period using milk production per test day instead of the others. Because the cubic spline regression models have excellent consistency in modeling the lactation curves. At the same time, Sahin and Efe (2010) reported that more flexible curves can be obtained with an increase in the number of knots.
Superiority of cubic spline regression model can be obtained only if determination of sufficient number of knots and position of them were successful. On the other hand, lactation curves obtained from flock mean can give only a guideline. Individual lactation curves are needed to evaluate individual performance of animals and use of them in selection (Cankaya et al., 2014; Adediran et al, 2008).
In this study, it was aimed to determine the sufficient number of knots and their position for milk yield of three different cattle breeds.
Materials and methods
Lactation curves have different tendencies in different breeds. To examine the tendencies and differences Jersey (J), Brown Swiss (BS) and Holstein Friesian (HF) breeds which are commonly raised in Turkey were used in this study. The data consisted of total 3480 test day record of 348 cattle in J breed obtained from Karaköy Agricultural State Farm in Samsun-Turkey, 3500 test day records of 350 cattle in BS breed obtained from Sultansuyu Agricultural State Farm in Malatya-Turkey and HF breed obtained from Ceylanpınar Agricultural State Farm in Şanlıurfa-Turkey. Only animals had 10 test days record in second and third lactation were included in analysis. Totally 10480 test day records for 1048 animal were used.
In three different cattle breeds, lactation milk yield measurements were analyzed by regressions of cubic splines with different knots for the estimation of the lactation curve using the SAS package (SAS, 1999; Sherchand et al., 1995). The methods used for estimation parameters and comparison criteria in this study were introduced as follows. In this study, the methods and comparison criteria used for parameter estimations are introduced as follows.
Cubic spline regression
Cubic spline regression, with no endpoint requirement, the number of parameters required, except β0, “k + 3” is the number (Stone and Koo, 1985). In this case, one (a) knots cubic spline function regression occurs as follows:

A cubic spline regression model:
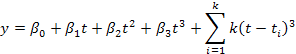
Where, t refers to days in milk yield at the test; β0, β1, β2, β3 and β4 are parameters to be estimated, and k is the number of knots in the splines.
Comparison criteria of the models
The goodness of the fit of the models was assessed according to the criteria Mean Square Error (MSE), the autocorrelation values of Durbin Watson (DW), Akaike Information Criteria (AIC), Coefficient of Determination (R2) (Vargas et al., 2000; Burnham and Anderson, 2002; White et al., 1999). According to the results of Kolmogorov Smirnov test, MSE, AIC and R2 values were not distributed normally (P<0.05). So, Kruskal Wallis H test was used for comparison of models with MSE, AIC and R2. Mann Whitney U test was used to separate the groups (Onder, 2018).
Results
In this study, which was carried out to statistically determine the most suitable knots in the cubic spline regression used to model lactation curves, lactation curves were estimated using 10 different knots combinations in the second and third lactation of J, BS and HF breeds. Determined knots and their positions were given in Table I.
The MSE, the autocorrelation values of DW, the information criteria of Akaike and the coefficient of determination estimated for three different cattle breeds for the knots and the combinations were given in Table II. As easily seen in Table II, increasing number of knots caused an observable increase on R2 values and decrease on MSE and AIC values.
Table I.- Position and code of the knots for ten different cubic spline models.
|
Code of knots |
Position of knots (day) |
Code of knots |
Position of knots (day) |
|
1 |
60 |
6 |
90, 120 |
|
2 |
90 |
7 |
120, 150 |
|
3 |
120 |
8 |
60, 90, 120 |
|
4 |
150 |
9 |
90, 120, 150 |
|
5 |
60,90 |
10 |
60, 90, 120, 150 |
As seen in Table II, in every cattle breeds, by means of MSE, AIC and R2 values differences among knots were found statistically significant (P<0.05) according to Kruskal Wallis H test results. In point of MSE the best position of knots were obtained from code of knots 10 for J and BS breeds. For HF breed the best position of knots were obtained from code of knots 3, 6, 8, 9 and 10. In point of AIC the best groups was code of knots 10 for J and BS breeds as MSE, for HF breed the best position of knots were obtained from code of knots 9 and 10. On the other hands, in point of R2 the best knot combination were 5, 8 and 10 for J breed, 5, 8, 9 and 10 for BS breed, and 9 and 10 for HF breed according to Table II.
When the autocorrelations examined it was understood that there was no autocorrelation (Uysal and Gunay, 2001) in code of knots 10 in J and BS breeds and code of knots 9 and 10 for HF breed.
As seen Table II, when the breeds evaluated together according to MSE, AIC, DW and R2; in J breed (MSE: 0.640c ± 0.065, DW: 2.272 ± 0.023, AIC: 16.927c ± 1.065, R2: 0.982a ± 0.002) and BS breed (MSE: 0.131e ± 0.016, DW: 2.326 ± 0.109, AIC: 3.567d ± 0.919, R2: 0.985a ± 0.001) for code of knots 10, in HF breed for code of knots 9 and 10 (code of knots 9: MSE: 1.600b ± 0,132, DW: 2.114 ± 0.020, AIC: 22.596c ± 0.783, R2: 0.972a ± 0.002, code of knots 10: MSE: 1.585b ± 0.207, DW: 2.244 ± 0,026, AIC: 21.120c ± 1.004, R2: 0.976a ± 0.003) were yield best results.
The estimation values for the parameters of three different breeds, different knot points and combinations are given in Table III. Cubic splines regression curves for individual lactation generated using the control days were presented in Figure 1. An increase in the number of nodes, in the dispersion of the points, is caused to obtain a more flexible curve and can express the best of the distribution shown in Figure 1.
As shown in Figure 1, the closest estimates to the actual milk yields were observed at code of knots 10 for J and BS breeds, respectively. Figure 1 also shows that code of knots 9 shows the estimate closest to the actual milk yields. Also, Figure 1 shows that the closest estimate of code of knots 9 to actual milk yields was obtained.
Table II.- Comparison results of MSE, DW, AIC and R2 values for different breeds according to each code of knots position.
Table III.- Predicted parameter values for three different cattle breeds and code of knot positions.
Discussion
MSE, DW, AIC, and R2 estimates results showed that the best knots were a position of knots 10 (60, 90, 120 and 150 days) for J and BS breeds, for HF breed the best knots were a position of 9 (90, 120 and 150 days) and 10 (60, 90, 120 and 150 days).
Makram et al. (2011) compare linear regression, quadratic regression, cubic regression and fixed factor models with cubic-spline interpolation models in first lactation Holstein cows for estimating the effects of inbreeding on milk yield. They found that the cubic-spline interpolation model with seven knots had the lowest AIC values. Bohmanova et al. (2008) compared a random regression model with both random and fixed regressions fitted by Legendre polynomials of order 4 with 3 alternative models fitting linear splines with 4, 5 and 6 knots at Canadian Holstein cows. As a result, they stated that the 6-knot spline model showed the best performance considering the model comparison criteria. Jamrozik et al. (2010) examined splines with a number of knots between 4 and 7 at random regression test-day models for different breeds. The results indicated that the optimal knot position for the linear splines differed between genetic and permanent environmental effects, as well as between traits and lactations. Cankaya et al. (2014) have compared wood lactation curve model and one and two knots cubic spline regression models at Jersey cows. They reported that the two-knot cubic spline regression model gave the best results. Similar results have obtained with the results of Bohmanova et al. (2007), Quinn et al. (2006), Gipson et al. (2010) and Koncagul and Yazgan (2011). Use of cubic spline regression to estimate lactation curves should be evaluated for other cattle breeds and milking animals such as goats and sheep.
Conclusion
It can be concluded that cubic spline regression models’ that four knots (60, 90, 120 and 150 days) for J and BS breeds and three knots (90, 120 and 150 days) for HF breed can be used for the modeling of individual lactation curves. Therefore, the use of cubic spline regression models would provide useful information on the herd management decision for milk production.
Acknowledgements
This research was presented as an oral presentation at the International Congress on Domestic Animal Breeding Genetics and Husbandry (ICABGEH-2018) held on 26-28 September 2018 in Antalya.
Statement of conflict of interest
The authors have no conflict of interest.
References
Adediran, S.A., Ratkowsky, D.A., Donaghy, D.J. and Malau-Aduli, A.E.O., 2008. Modelling the effect of stocking rate on the lactation profiles of grazing Holstein-Friesian dairy cows using cubic splines. Curr. Top. Dairy Prod., 13: 25-32.
Bohmanova, J., Jamrozik, J., Miglior, F., Misztal, I. and Sullivan, P.G., 2007. Legendre polynomials versus linear splines in the Canadian test-day model. Interbull Bull., 37: 42-48
Bohmanova, J., Miglior, F., Jamrozik, J., Misztal, I. and Sullivan, P.G., 2008. Comparison of random regression models with legendre polynomials and linear splines for production traits and somatic cell score of Canadian Holstein cows. J. Dairy Sci., 91: 3627-3638. https://doi.org/10.3168/jds.2007-0945
Burnham, K.P. and Anderson, D.R., 2002. Model selection and multi model inference, 2nd edition. Springer, New York, pp. 353.
Cankaya, S., Sahin, M. and Abacı, S.H., 2014. Comparison of wood and cubic spline models for the first lactation curve of Jersey cows. J. Anim. Pl. Sci., 24: 1045-1049.
Cunha, D.D.N.F.V., Pereira, J.C., Campos, O.F.D., Braga, J.L. and Martuscello, J.A., 2010. Selection of models of lactation curves to use in milk production simulation systems. Rev. Bras. Zootec., 39: 891-902. https://doi.org/10.1590/S1516-35982010000400026
de Groot, B.J., Keown, J.F., Kachman, S.D. and Vleck, D.V., 2003. Cubic splines for estimating lactation curves and genetic parameters on first lactation Holstein cows treated with bovine somatotropin. 15th Annual Conference on Applied Statistics in Agriculture, Kansas, pp. 150-163. https://doi.org/10.4148/2475-7772.1181
Gantner, V., Jovanovac, S., Klopčič, M., Cassandro, M., Raguž, N. and Kuterovac, K., 2009. Methods for estimation of daily and lactation milk yields from alternative milk recording scheme in Holstein and Simmental cattle breeds. Ital. J. Anim. Sci., 8: 519-530. https://doi.org/10.4081/ijas.2009.519
Gipson, T., Rovai, M., Capuco, A., Sahlu, T. and Dawson L., 2010. Effect of number and placement of cubic spline knots in the lactation curve of extended lactations. 10th International Conference on Goats. Brazil, pp. 11-27.
Harder, I., Stamer, E., Junge, W. and Thaller, G., 2019. Lactation curves and model evaluation for feed intake and energy balance in dairy cows. J. Dairy Sci., 102: 7204-7216. https://doi.org/10.3168/jds.2018-15300
Jamrozik, J., Bohmanova, J. and Schaeffer L.R., 2010. Selection of locations of knots for linear splines in random regression test day models. J. Anim. Breed. Genet., 127: 87-92. https://doi.org/10.1111/j.1439-0388.2009.00829.x
Koncagul, S. and Yazgan K., 2011. Comparison of spline and legendre polynomial functions with conventional methods for describing lactation curves of Holstein dairy cows. J. Anim. Prod., 52: 17-23.
Lopez-Villalobos, N., Mc Naughton, L.R. and Spelman, R.J., 2005. The relationship between lactation persistency and reproductive performance in New Zealand dairy cattle. 56th Annual Meeting of the EAAP, June 5-8, Uppsala, Sweden.
Makram, J.G., Jeffrey, F.K. and Dale, V.V., 2011. Cubic-spline interpolation to estimate effects of inbreeding on milk yield in first lactation Holstein cows. Genet. Mol. Biol., 34: 443-450. https://doi.org/10.1590/S1415-47572011000300013
Onder, H., 2018. Nonparametric statistical methods used in biological experiments. Black Sea J. Engin. Sci., 1: 1-6.
Papajcsik, I.A. and Bodero, J., 1988. Modeling lactation curves of Friesian cow in a subtropical climate. Anim. Sci., 47: 201-207. https://doi.org/10.1017/S0003356100003275
Quinn, I.L., Killen, L. and Buckley, F., 2006. Empirical algebraic modelling of live weight of Irish dairy cows over lactation. Livest. Sci., 103: 141-147. https://doi.org/10.1016/j.livsci.2006.02.003
Sahin, A., Ulutas, Z., Yildirim, A., Yuksel, A. and Genc, S., 2014. Comparison of different lactation curve models of Anatolian Buffaloes. Kafkas Univ. Vet. Fak., 20: 847-855. https://doi.org/10.9775/kvfd.2014.11140
Sahin, M. and Efe, E., 2010. Use of cubic spline regressions in modeling dairy cattle lactation curves. Kahramanmaras Sutcu Imam Univ. J. Nat. Sci., 13: 17-22.
SAS, 1999. SAS online doc, Version 8. SAS Institute Inc., Cary, NC.
Sherchand, L., Mcnew, R.W., Kellogg, D.W. and Johnson, Z.B., 1995. Selection of a mathematical model to generate lactation curves using daily milk yields of Holstein cows. J. Dairy Sci., 78: 2507-2513. https://doi.org/10.3168/jds.S0022-0302(95)76880-1
Silvestre, A.M., Petim-Batista, T. and Colaço, J., 2006. The accuracy of seven mathematical functions in modeling dairy cattle lactation curves based on test-day records from varying sample schemes. J. Dairy Sci., 89: 1813-1821. https://doi.org/10.3168/jds.S0022-0302(06)72250-0
Stone, C.J. and Koo, C.Y., 1985. Additive splines in statistics. Proceedings of the statistical computing section ASA. American Statistical Association, Washington, DC, pp. 45-48.
Uysal, M. and Gunay, S., 2001. Some tests for negative autocorrelation in the inconclusive area according to the Durbin-Watson criterion. Anadolu Univ. J. Sci. Technol., 2: 277-284.
Vargas, B., Koopsi W.J., Herrero M. and Van Arendonk, J.A.M., 2000. Modeling extended lactations of dairy cows. J. Dairy Sci., 83: 1371-1380. https://doi.org/10.3168/jds.S0022-0302(00)75005-3
Walker, C.G., O’Sullivan, M.J., Zhu, Y. and Hsu, S., 2010. Regression spline fitting with applications. Proceedings of the 45th annual conference of the ORSNZ, pp. 271-280.
White, I.M.S. and Brotherstone, S., 1997. Modelling lactation curves with cubic splines. Interbull Bull., 16: 80-82.
White, I.M.S., Thompson, R. and Brotherstone S., 1999. Genetic and environmental smoothing of lactation curves with cubic splines. J. Dairy Sci., 82: 632-638. https://doi.org/10.3168/jds.S0022-0302(99)75277-X
Younesi, H.N., Shariati, M.M., Zerehdaran, S., Nooghabi, M.J. and Løvendahl, P., 2019. Using quantile regression for fitting lactation curve in dairy cows. J. Dairy Res., 86: 19-24. https://doi.org/10.1017/S0022029919000013
To share on other social networks, click on any share button. What are these?


