

Comparing Predictive Performances of Tree-Based Data Mining Algorithms and MARS Algorithm in the Prediction of Live Body Weight from Body Traits in Pakistan Goats


Comparing Predictive Performances of Tree-Based Data Mining Algorithms and MARS Algorithm in the Prediction of Live Body Weight from Body Traits in Pakistan Goats
Senol Celik
Department of Animal Science, Faculty of Agriculture, Bingol University, Bingol, Turkey
ABSTRACT
The main purpose of this investigation was to comparatively evaluate predictive performances of multivariate adaptive regression splines (MARS), chi-squared automatic interaction detector (CHAID), exhaustive CHAID and classification and regression trees (CART) data mining algorithms in predicting live body weight as a continuous response variable by means of morphological measurements i.e. live body weight (LBW), body length (BL), withers height (WH), rump height (RH), belly girth (BG) and chest girth (CG) as continuous predictors from 130 Pakistan goats. Also, sex factor was included as a possible nominal predictor in the current study. To measure predictive performances of the tested algorithms, model evaluation criteria such as the correlation coefficient between actual and predicted LBW values (r), Akaike’s and corrected Akaike information criterion (AIC and AICc), root-mean-square error (RMSE), mean absolute deviation (MAD), standard deviation ratio (SDratio), and mean absolute percentage error (MAPE) were estimated. According to these criteria, MARS produced better predictive accuracy in explaining the variability in LBW compared with others. MARS produced the best fit for 3rd interaction order on the basis of the smallest generalized cross validation (GCV). In the MARS algorithm, BL and CG were the predictors that had the highest relative importance (100%) in the prediction of live body weight and these two predictors could be considered as indirect selection criteria for breeding schemes. It could be suggested that the CART, the CHAID, the Exhaustive CHAID and especially MARS algorithms in the prediction of live body weight were significant statistical tools in sophistically describing the studied breed standards for breeding purposes.
Article Information
Received 07 September 2018
Revised 01 December 2018
Accepted 20 December 2018
Available online 13 May 2019
Key words
Data Mining, CHAID, Exhaustive CHAID, CART, MARS, Body measurement.
DOI: http://dx.doi.org/10.17582/journal.pjz/2019.51.4.1447.1456
* Corresponding author: senolcelik@bingol.edu.tr
0030-9923/2019/0004-1447 $ 9.00/0
Copyright 2019 Zoological Society of Pakistan
Introduction
Goats are well adapted to life in the dry parts of the tropics where there is usually a shortage of food for humans and animals (Egwu et al., 1995). It is well-known that small ruminants play a main role in developing national economy and meeting basic requirements of people (Karabacak et al., 2017).
Predicting live body weight (LBW) is a noteworthy topic to find out proper drug dose, feed amount, and marketing for an animal under rural conditions without weighing instrument (Eyduran et al., 2013). The prediction of LBW and its causal relationships with other body measurements for ideal breeding studies is imperative to increase meat production per animal. In other words, determination of the body measurements connected with live body weight is indispensable for gaining superior offspring in the goat selection strategies and experimental studies (Lawrence and Fowler, 2002; Cam et al., 2010). An effectual characterization of the studied breed standards in goats is desired for conserving gene sources and producing elite populations. The predictive power of the characterization is possible through selecting effective statistical approaches (Eyduran et al., 2017) and influent predictors.
Eyduran et al. (2016) highlighted that usage of data mining algorithms in predicting live body weight from morphological traits in small ruminants was more informative for developing better breeding strategies. Although multiple regression models seriously affected by multicollinearity problems were adopted for predicting LBW (Pesmen and Yardimci, 2008; Coronado et al., 2015; Moaeen-ud-Din et al., 2016), much more robust studies have been conducted in predicting live body weight by morphological measurements through the CART (Ali et al., 2015; Yordanova et al., 2015; Celik et al., 2018), the CHAID (Ali et al., 2015; Koç et al., 2017), the MARS (Eyduran et al., 2017a; Celik et al., 2018; Erturk, 2018; Aytekin et al., 2018) and the artificial neural networks (ANNs) (Ali et al., 2015; Celik et al., 2018) in various farm animal species. To illustrate, Eyduran et al. (2017) captured the best one among the CART, the CHAID, and the ANNs algorithms in the prediction of live body weight (LBW) by body measurements taken from Beetal goat reared under Pakistan harsh conditions. However, the MARS application is seldom in literature (Aytekin et al., 2018). To date, an implementation of CART, CHAID tree-based algorithms and especially MARS algorithm (with/without interaction effect) were present in the prediction of LBW using morphological traits in the Pakistan goat. Use of the powerful data mining algorithms with the purpose of attaining more accurate outcomes is unavoidable for regression type problems like the LBW prediction (Celik et al., 2018) and may be gained more importance.
Hence, the goal of the present study was to comparatively evaluate predictive performances of the CART, the CHAID, the Exhaustive CHAID and the MARS algorithms in the prediction of LBW from several body measurements in the Pakistan goats.
Materials and methods
The data were collected from 130 goats reared at the Experimental Station, University of Balochistan, Quetta, Pakistan. The available data were taken partially from the former study conducted by Eyduran et al. (2013) in order to evaluate predictive performances of the CART (Ali et al., 2015), the CHAID (Akin et al., 2018; Gozuacik et al., 2018; Kovalchuk et al., 2017), the Exhaustive CHAID and the MARS algorithms (Celik et al., 2018).
To predict the live body weight (LBW), body length (BL), withers height (WH), rump height (RH), belly girth (BG) and chest girth (CG) were measured at varying ages (24 to 48 months) as suggested by Abegaz and Awgichew (2009). Descriptive statistics of morphological measurements of the Pakistan goats are presented in Table I.
CHAID is graphical algorithms that create regression tree structures and analyze qualitative and quantitative data, simultaneously. CHAID proposed by Kass (1980) has three stages (merging, partitioning and stopping) and is a tree-based algorithm that recursively uses multi-way splitting to form homogenous subsets on by taking a basis of Bonferroni adjustment until obtaining the least differences between the actual and predicted values in a response variable (Orhan et al., 2016; Akin et al., 2016; Eyduran et al., 2016). A quantitative input variable in the CHAID algorithms is converted into an ordinal variable (Orhan et al., 2016).
CHAID is a non-parametric analysis for a criterion variable with two or more categories. This permits researchers to perform the segmentation with respect to that variable and in agreement with the combination of a range of predictors (Díaz-Pérez et al., 2005; Legohérel et al., 2015).
The Exhaustive CHAID, as a modification of the tree-based CHAID algorithm, applies a more detailed merging and testing of predictor variables, and requires more computing time (Tang et al., 2005).
The CART algorithm is proposed by Breiman et al. (1984). The CART is a binary decision tree algorithm made by splitting a node into two child nodes repeatedly, beginning with the root node that contains the whole learning sample. Some earlier studies reported for more detailed information on the CART and CHAID algorithms were reported (Akin et al., 2017a, b, c, 2018).
The MARS algorithm developed by Jerome Friedman in the year 1991 (Friedman, 1991) is a nonparametric regression technique specifying piecewise basis functions for revealing the complex relationship between a response variable and a set of predictors, and it automatically choices knot locations. Prediction equation of the MARS algorithm can be written below:

Where, βo and βm are the basis function parameters of the MARS algorithm used on the basis of the least squares criterion. The spline basis function Bm(x), can be implemented as:
Table I.- Descriptive statistics of some morphological characteristics of Pakistan goats .
|
Body measurements |
Variables |
n |
Minimum |
Maximum |
Mean |
Std. Error |
Std. Deviation |
|
Live weight (cm) |
LBW |
130 |
20.00 |
85.00 |
35.90 |
0.97 |
11.05 |
|
Body length (cm) |
BL |
130 |
48.26 |
106.00 |
71.65 |
1.20 |
13.64 |
|
Withers height (cm) |
WH |
130 |
58.00 |
103.00 |
75.33 |
0.89 |
10.15 |
|
Rump height (cm) |
RH |
130 |
58.42 |
101.00 |
78.01 |
0.86 |
9.85 |
|
Belly girth (cm) |
BG |
130 |
62.00 |
114.30 |
85.92 |
0.96 |
10.96 |
|
Chest girth (cm) |
CG |
130 |
54.00 |
99.00 |
76.84 |
0.77 |
8.82 |
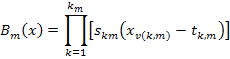
Where, km is the number of knots, skm takes either 1 or -1 and presents the right/left regions of the related step function, v(k, m) is the label of the input variable and tk, m is the knot location (Friedman, 1991).
The generalized cross validation (GCV) is approved to eliminate the redundant basis functions (Friedman and Silverman, 1989; Kornacki and Ćwik, 2005).

Where, N is the number of data and C(B) is a complexity penalty increasing with the number of basis function in the model and which is expressed as:
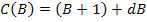
Where, d is a penalty for each basis function entered into the model and number of the basis functions (Friedman, 1991).
To comparatively the predictive performances of the MARS, the CART, the CHAID and the exhaustive CHAID in the 10-fold cross-validation, the following model evaluation criteria were calculated (Willmott and Matsuura, 2005; Liddle, 2007; Takma et al., 2012):
1. Pearson correlation coefficient (r) between the actual and predicted LBW values:
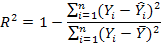
2. Coefficient of determination
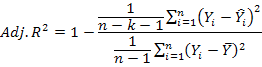
3. Adjusted coefficient of determination
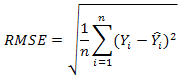
4. Root-mean-square error (RMSE) expressed by the following formula:
5. Standard deviation ratio (SDratio):

6. Mean absolute percentage error (MAPE):
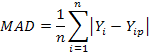
7. Mean absolute deviation (MAD):
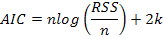
8. Akaike Information Criteria (AIC):
9. Corrected Akaike Information Criteria AIC:
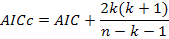
Where, 2k(k+1) / n – k – 1 bias-correction term. This term is used when n / k <40 or the sample size is small (Hu, 2007). n is the number of cases in a set, k is the number of model parameters (number of the selected terms in the MARS), Yi is the actual (observed) value of a response variable (LBW), Yip is the predicted value of a response variable(LBW), sm is the standard deviation of model errors, sd is the standard deviation of a response variable (LBW), RSS: Residual sum square (RSS is the sum of the squares of residuals (deviations predicted from actual values of data).
In addition, a two-tailed t-test (with the Bonferroni adjustment) of the significance of the differences between correlation coefficients (r) among prediction models was carried out, whose test statistic was presented by the following formula (Kenny, 1987; Eyduran et al., 2017b):
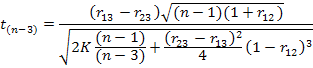

Where, r13 is a correlation coefficient between observed and predicted values for the first model, r23 is a correlation coefficient between observed and predicted values for the second model, r12 is a correlation coefficient between the values predicted by the first and the second model, n is a sample size.
In the CHAID, the Exhaustive CHAID and the CART algorithms, minimum parent-child node ratio 4:2 is taken for the best predictive solution. MARS algorithm used order interaction of 3 to achieve the best solution fpr the smallest GCV error.
Statistical evaluations on the CHAID, the Exhaustive CHAID, and the CART tree-based algorithms were made using IBM SPSS version 23, whereas MARS algorithm was specified by the earth package of R Studio program (Milborrow, 2011, 2018). The MARS model with the smallest GCV, SDRATIO, RMSE, MAPE, MAD, AIC, AICc and the highest coefficient of determination (R2) and Pearson coefficient (r) between observed and predicted values of LBW was appropriated as the best one. All the statistical calculations were implemented through the package `earth` of R Studio software (R Core Team, 2014). The R commands written for the present study were presented in Appendix section for the future works to be conducted for regression type problems.
Results
We aimed here to find morphological linear measurements connected with LBW in the goats using robust statistical techniques. In that, predictive performances of the CHAID, the Exhaustive CHAID, the CART and the MARS algorithms were measured as part of predicting LBW. Their goodness-of-fit-criteria outcomes are summarized in Table II. The superiority order in the predictive accuracy of the declared algorithms was MARS > CHAID > Exhaustive CHAID > CART in relation to the estimated model evaluation criteria. Because the criteria of goodness of fit of the first algorithm were found better. The predictive performance of the MARS algorithm was recorded better.
CHAID algorithm formed a decision tree structure, and its visual outcome is shown in Figure 1. Exhaustive CHAID algorithm formed a decision tree structure, and its outcome is displayed in Figure 2. CART algorithm formed a regression tree structure, and its outcome is depicted in Figure 3.
Table II.- Predictive performance of CHAID, Exhaustive CHAID, CART and MARS algorithms.
|
r |
R2 |
Adj. R2 |
RMSE |
SD ratio |
MAPE |
MAD |
RAE |
AIC |
AICc |
|
|
CHAID |
0.80 |
0.64 |
0.63 |
6.60 |
0.60 |
13.24 |
4.59 |
0.18 |
501 |
501 |
|
Exh. CHAID |
0.77 |
0.59 |
0.58 |
7.02 |
0.64 |
13.96 |
4.95 |
0.19 |
517 |
517 |
|
CART |
0.67 |
0.45 |
0.43 |
8.15 |
0.74 |
15.34 |
5.43 |
0.22 |
554 |
554 |
|
MARS |
0.95 |
0.91 |
0.86 |
3.32 |
0.30 |
8.49 |
2.67 |
0.09 |
402 |
451 |
Table III.- Results of the MARS algorithm for Pakistan goats.
|
Basic functions |
Coefficients |
|
|
Intercept |
-23.524 |
|
|
SexM |
BF1 |
-108.508 |
|
max(0, 60.96-BL) |
BF2 |
-3.152 |
|
max(0, BL-60.96) |
BF3 |
2.180 |
|
max(0, WH-87) |
BF4 |
1.788 |
|
max(0, 88-WH) |
BF5 |
1.692 |
|
max(0, 73.66-RH) |
BF6 |
3.121 |
|
max(0, RH-83.82) |
BF7 |
4.855 |
|
max(0, RH-86.36) |
BF8 |
-6.877 |
|
max(0, BG-86) |
BF9 |
1.324 |
|
max(0, CG-83.82) |
BF10 |
-2.635 |
|
BG * SexM |
BF11 |
1.361 |
|
max(0, BL-63.5) * max(0, 88-WH) |
BF12 |
-0.078 |
|
max(0, BL-73) * max(0, RH-73.66) |
BF13 |
-0.087 |
|
max(0, BL-60.96) * max(0, CG-76.2) |
BF14 |
-0.259 |
|
max(0, BL-63.5) * max(0, CG-81.28) |
BF15 |
0.385 |
|
max(0, BL-63.5) * max(0, 86-CG) |
BF16 |
0.817 |
|
max(0, 70-BL) * max(0, 86-CG) |
BF17 |
0.142 |
|
max(0, BL-71.12) * max(0, 86-CG) |
BF18 |
0.764 |
|
max(0, WH-66.04) * max(0, 102-BG) |
BF19 |
-0.423 |
|
max(0, WH-68.58) * max(0, 102-BG) |
BF20 |
0.641 |
|
max(0, WH-71.12) * max(0, 102-BG) |
BF21 |
0.198 |
|
max(0, WH-76.2) * max(0, 102-BG) |
BF22 |
-0.254 |
|
max(0, 88-WH) * max(0, BG-88.9) |
BF23 |
-0.121 |
|
max(0, 88-WH) * max(0, CG-81) |
BF24 |
0.380 |
|
max(0, 88-WH) * max(0, 81-CG) |
BF25 |
-0.059 |
|
max(0, RH-71.12) * max(0, 102-BG) |
BF26 |
0.818 |
|
max(0, RH-73.66) * max(0, BG-81.28) |
BF27 |
0.075 |
|
max(0, RH-73.66) * max(0, 81.28-BG) |
BF28 |
-0.493 |
|
max(0, RH-74.93) * max(0, 102-BG) |
BF29 |
-1.527 |
|
max(0, RH-76.2) * max(0, 102-BG) |
BF30 |
1.093 |
|
max(0, 71.12-RH) * max(0, 86-CG) |
BF31 |
-0.216 |
|
max(0, RH-71.12) * max(0, 86-CG) |
BF32 |
-0.158 |
|
max(0, 102-BG) * max(0, 76.2-CG) |
BF33 |
0.017 |
|
max(0, 73-BL) * max(0, RH-73.66) *SexM |
BF34 |
-0.296 |
|
max(0, BL-64) * max(0, WH-68.58) *max(0, 86-CG) |
BF35 |
-0.279 |
|
max(0, BL-64) * max(0, 68.58-WH) *max(0, 86-CG) |
BF36 |
-0.068 |
|
max(0, BL-64) * max(0, WH-71.12) *max(0, 86-CG) |
BF37 |
0.271 |
|
max(0, BL-70) * max(0, WH-71.12) *max(0, 86-CG) |
BF38 |
-0.269 |
|
max(0, BL-70) * max(0, 71.12-WH) *max(0, 86-CG) |
BF39 |
-0.157 |
|
max(0, BL-70) * max(0, WH-74) *max(0, 86-CG) |
BF40 |
0.287 |
|
max(0, 71.12-BL) * max(0, RH-76.2) *max(0, 102-BG) |
BF41 |
0.030 |
|
max(0, BL-64) * max(0, 78-RH) *max(0, 86-CG) |
BF42 |
-0.032 |
|
max(0, WH-66.04) * max(0, RH-71.12) *max(0, 102-BG) |
BF43 |
-0.054 |
|
max(0, WH-71.12) * max(0, RH-73.66) *max(0, 102-BG) |
BF44 |
0.051 |
BL, body length; WH, withers height; RH, rump height; BG, belly girth; CG, chest girth; BF, basic functions.
In relation to CART algorithm results, the goats with BL ≤ 77.500 cm produced the average LBW of 32.510 kg, whereas those with BL > 77.500 provided the average LBW of 47.690 kg.
Results of the MARS algorithm for Pakistan goat are reported in Table III. The GCV value of the MARS model was 10.99. For the Pakistan goats, the observed LBW values of the MARS model with the interaction order of 3 exhibited much better fit.
The relative importance of the significant predictors in Table IV is given.
Table IV.- Relative importance of model independent variables.
|
Variables |
GCV |
No. of subsets |
|
BL |
100.0 |
44 |
|
CG |
100.0 |
44 |
|
RH |
72.9 |
43 |
|
BG |
63.9 |
42 |
|
SEX |
63.9 |
42 |
|
WH |
58.0 |
38 |
Discussion
Use of the data mining algorithms is still not adequate for predicting LBW by means of morphological measurements and environmental factors as predictors in small ruminant literature (Ali et al., 2015). Eyduran et al. (2016) underlined significance of these sophistical approaches. Therefore, the present work was considered to fill the gap in the literature. The worst performance in the current work was recorded in the CART tree-based algorithm. Yakubu (2012) also obtained low R2 for predicting LBW of Uda rams. The CART R2 estimate reported by Yakubu (2012) was much lower than the estimates of MARS and both CHAID algorithms stated here.
With the scope of multivariate linear regression models, Coronado et al. (2015) predicted LBW by means of BL, TL, HG, RL and width, HL, and EL for local Amatepec (0.82 R2) and Tejupilco (0.76 R2) goats in Southern México, which was almost in agreement with the corresponding R2 estimates for both CHAID algorithms, but lower than the estimate of the MARS algorithm. Perez et al. (2016) predicted LBW through a special prediction equation, LBW= ((2*RH+4*BL+6*HG)/10)-53 where Rump height (RH), Body Length (BL) and Heart Girth (HG), and reported Pearson correlation coefficient of 0.899 between the actual and predicted LBW values of the goats reared in Philippines. The previous estimate was found lower than that (0.95) obtained for only MARS in the Pakistan goats (Table II). The present results were found much better in comparison with those reported by Moaeen-ud-Din et al. (2016) with 0.210 and 0.124 R2 in predicting LBW of Beetal (LBW = 24.39 + 0.45HG+0.42BL) and Crossbred (LBW = 35.51 – 0.054 WH + 0.424 HG) goats in Pakistan. We could say that the multiple regression model built by Moaeen-ud-Din et al. (2016) was inadequate in predicting LBW. This means that the used models in the earlier study were insufficient or the influential predictors were unavailable in explaining the variability in LBW.
Pesmen and Yardimci (2008) had a bit higher R2 of 0.95 in the Saanen goats through the following prediction equation; LBW= - 146.313 + 1.081*HG + 0.679*BL + 3.013*SC than the present MARS modeling. However, the fact that the present MARS model included interaction effects could be considered as an advantage for breeding purposes. Benyi (1997) found higher R2 for linear (0.87 to 0.92 R2) and geometric functions (0.97 to 0.99 R2) in the West African goats and Sahel x West African Dwarf goats, whereas the present R2 estimates for other algorithms except for CART were found much better than regression results of Chitra et al. (2012).
Eyduran et al. (2017b) obtained a lower R2 of 0.75 in multiple linear regression model (Ordinary Least Squares Method) for the LBW prediction in Beetal goats and they found that sex, BL, SC (Shank circumference) and RH (Rump height) (P<0.01) compared with the present estimates of MARS and both CHAID algorithms (Table II). Also, Eyduran et al. (2017b) obtained for SD ratio the range from 0.5030 (RBF algorithm) to 0.5727 (MLP), which was better than those found for the-tree-based CART and CHAID algorithms as expected, but these two ANN algorithms were much worse than that obtained for MARS (0.30) in the present study. Similarly, Celik et al. (2018), Aytekin et al. (2018) and Ertürk (2018) also emphasized the superiority of the MARS algorithms.
The wide variation may be ascribed to the variability in breed, age, gender, rearing systems, predictors and interaction degrees and effects, as well as especially statistical techniques. However, it is suggested that efficiently revealing predictive performances of the evaluated algorithms should be used for different goat breeds and much wider populations to generalize the achieved results.
Conclusions
The MARS algorithm outperformed tree-based data mining algorithms in predictive accuracy and effectively revealed interaction effects between significant predictors. In conclusion, the CART, the CHAID, and especially the MARS algorithms in the predicting LBW from morphological traits were significant statistical tools in sophistically describing the breed standards and establishing indirect selection criteria in practice for breeding purposes.
There is supplementary material associated with this article. Access the material online at: http://dx.doi.org/10.17582/journal.pjz/2019.51.4.1447.1456
Statement of conflict of interest
The authors declare no conflict of interest.
References
Abegaz, S. and Awgichew, K., 2009. Technical Bulletin No. 23: Estimation of weight and age of sheep and goats (eds. A. Yami, T.A. Gipson and R.C. Merkel). Ethiopia Sheep and Goat Productivity Improvement Program (ESGPIP). Ethiopia.
Akin, M., Eyduran, E. and Reed, B.M., 2016. Using the CHAID data mining algorithm for tissue culture medium optimization. In: In vitro cellular and developmental biology-animal. Vol. 52. Spring ST, New York, USA, pp. 233.
Akin, M., Hand, C., Eyduran, E. and Reed, B.M., 2017. Predicting minor nutrient requirements of hazelnut shoot cultures using regression trees. Pl. Cell Tissu. Organ Cult., 132: 545-559. https://doi.org/10.1007/s11240-017-1353-x
Akin, M., Eyduran, E. and Reed, B.M., 2017a. Use of RSM and CHAID data mining algorithm for predicting mineral nutrition of hazelnut. Pl. Cell Tissu. Organ Cult., 128: 303-316. https://doi.org/10.1007/s11240-016-1125-z
Akin, M., Eyduran, E. and Reed, B.M., 2017b. Developing of optimal tissue culture medium for Hazelnuts. IX International Congress on Hazelnut, 15-19 August, Atakum, Samsun, Turkey.
Akin, M., Eyduran, E. Niedz, R.P. and Reed, B.M., 2017c. Developing hazelnut tissue culture medium free of ion confounding. Pl. Cell Tissu. Organ Cult., 130: 483-494. https://doi.org/10.1007/s11240-017-1238-z
Akin, M., Hand, C., Eyduran, E. and Reed, B.M., 2018. Predicting minor nutrient requirements of hazelnut shoot cultures using regression trees. Pl. Cell Tissu. Organ Cult., 132: 545-559. https://doi.org/10.1007/s11240-017-1353-x
Ali, M., Eyduran, E., Tariq, M.M., Tirink, C., Abbas, F., Bajwa, M.A., Baloch, M.H., Nizamani, A.H., Waheed, A., Awan, M.A., Shah, S.H., Ahmad, Z. and Jan, S., 2015. Comparison of artificial neural network and decision tree algorithms used for predicting live weight at post weaning period from some biometrical characteristics in Harnai Sheep. Pakistan J. Zool., 47: 1579-1585.
Aytekin, I., Eyduran, E., Koksal, K., Akşahan, R. and Keskin, I., 2018. Prediction of fattening final live weight from somebody measurements and fattening period in young bulls of crossbred and exotic breeds using MARS data mining algorithm. Pakistan J. Zool., 50: 189-195. https://doi.org/10.17582/journal.pjz/2018.50.1.189.195
Benyi, K., 1997. Estimation of live weight from chest girth in pure and crossbred West African goats. Trop. Anim. Hlth. Prod., 29: 124-128. https://doi.org/10.1007/BF02632332
Bilgin, O.C., Emsen, E. and Davis, M.H., 2004. Comparison of non-linear models for describing the growth of scrotal circumference in Awassi male lambs. Small Rumin. Res., 52: 155-160. https://doi.org/10.1016/S0921-4488(03)00251-7
Breiman, L., Friedman, J.H., Olshen, R. and Stone, C.J., 1984. Classification and regression tree. Wadsworth Brooks/Cole Advanced Books & Software, Pacific California.
Cam, M.A., Olfaz, M. and Soydan, E., 2010. Possibilities of using morphometrics characteristics as a tool for body weight prediction in Turkish hair goats (Kilkeci). Asian J. Anim. Vet. Adv., 5: 52-59. https://doi.org/10.3923/ajava.2010.52.59
Celik, S., Eyduran, E., Tatliyer, A., Karadas, K., Kara, M.K. and Waheed, A., 2018. Comparing predictive performances of some nonlinear functions and multivariate adaptive regression splines (MARS) for describing the growth of Dera Dın Panah (DDP) goat in Pakistan. Pakistan J. Zool., 50: 1187-1190. https://doi.org/10.17582/journal.pjz/2018.50.3.sc2
Chitra, R., Rajendran, S., Prasanna, D. and Kirubakaran, A., 2012. Prediction of body weight using appropriate regression model in adult female Malabari goat. Vet. World, 5: 409-411. https://doi.org/10.5455/vetworld.2012.409-411
Coronado, E.J.D., Hernández, G.T., Mendo, O.H. and Rubio, R.R., 2015. Zoometric measures and their utilization in prediction of live weight of local goats in southern México. Springer Plus, 4: 1-8.
Díaz-Pérez, F.M., Bethencourt-Cejas, M. and Álvarez-González, J.A., 2005. The segmentation of Canary island tourism markets by expenditure: Implication for tourism policy. Tourism Manage., 26: 961-964. https://doi.org/10.1016/j.tourman.2004.06.009
Egwu, G.O., Onyeyili, P.A., Chibuzo, G.A. and Ameh, J.A., 1995. Improved productivity of goats and utilisation of goat milk in Nigeria. Small Rumin. Res., 16: 195-201. https://doi.org/10.1016/0921-4488(95)00630-4
Ertürk, Y.E., 2018. Description of factors influencing final fattening weight in domestic beef cattle breeds through MARS algorithm. Pakistan J. Zool., 50: 1731-1737.
Eyduran, E., Waheed, A., Tariq, M.M., Iqbal, F. and Ahmad, S., 2013. Prediction of live weight from morphological characteristics of commercial goat in Pakistan using factor and principal component scores in multiple linear regression. J. Anim. Pl. Sci., 23: 1532-1540.
Eyduran, E., Keskin, I., Erturk, Y.E., Dag, B., Tatliyer, A., Tirink, C., Aksahan, R. and Tariq, M.M., 2016. Prediction of fleece weight from wool characteristics of sheep using regression tree method (CHAID algorithm). Pakistan J. Zool., 48: 957-960.
Eyduran, E., Akkus, O., Kara, M.K., Tirink, C. and Tariq, M.M., 2017a. Use of multivariate adaptive regression splines (MARS) in predicting body weight from body measurements in Mengali Rams. International Conference on Agriculture, Forest, Food, Sciences and Technologies, ICAFOF, 15-17 May 2017, Cappadocia-Turkey.
Eyduran, E., Zaborski, D., Waheed, A., Celik, S., Karadas, K. and Grzesiak, W., 2017b. Comparison of the predictive capabilities of several data mining algorithms and multiple linear regression in the prediction of body weight by means of body measurements in the indigenous Beetal goat of Pakistan. Pakistan J. Zool., 49: 257-265. https://doi.org/10.17582/journal.pjz/2017.49.1.257.265
Friedman, J.H. and Silverman, B.W., 1989. Flexible parsimonious smoothing and additive modeling. Technometrics, 31: 3-21. https://doi.org/10.1080/00401706.1989.10488470
Friedman, J.H., 1991. Multivariate adaptive regression splines. Annls. Statist., 19: 1-141. https://doi.org/10.1214/aos/1176347973
Gozuacik, C., Eyduran, E., Cam, H. and Kara, M.K., 2018. Detection of infection preferences of the alfalfa seed chalcid, Bruchophagus roddi Gussakovskiy, 1933 (Hymenoptera: Eurytomidae) in alfalfa (Medicago sativa L.) fields of Igdir, Turkey. Legume Res., 41: 150-154.
Grzesiak, W. and Zaborski, D., 2012. Examples of the use of data mining methods in animal breeding. InTech Open, ISBN 978-953-51-0720-0. https://doi.org/10.5772/50893
Hu, S., 2007. Akaike information criterion. Center for Research in Scientific Computation North Carolina State University Raleigh, NC.
SPSS, 2015. IBM SPSS statistics for windows, Version 23.0. IBM Corp., Armonk, NY.
Karabacak, A., Celik, S., Tatliyer, A., Keskin, I., Erturk, Y.E., Eyduran, E., Javed, Y. and Tariq, M.M., 2017. Estimation of cold carcass weight and body weight from several body measurements in sheep through various data mining algorithms. Pakistan J. Zool., 49: 1731-1738. https://doi.org/10.17582/journal.pjz/2017.49.5.1731.1738
Karakus, K., Eyduran, E., Aygun, T. and Javed, K., 2010. Appropriate growth model describing some testicular characteristics in Norduz male lambs. J. Anim. Pl. Sci., 20: 1-4.
Kass, G.V., 1980. An exploratory technique for investigating large quantities of categorical data. Appl. Stat., 29: 119-127. https://doi.org/10.2307/2986296
Kenny, D.A., 1987. Statistics for the social and behavioral sciences. Little Brown, USA
Khan, M.A., Tariq, M.M., Eyduran, E., Tatliyer, A., Rafeeq, M., Abbas, F., Rashid, N., Awan, M.A. and Javed, K., 2014. Estimating body weight from several body measurements in Harnai Sheep without multicollinearity problem. J. Anim. Pl. Sci., 24: 120-126.
Koc, Y., Eyduran, E. and Akbulut, O., 2017. Application of regression tree method for different data from animal science. Pakistan J. Zool., 49: 599-607. https://doi.org/10.17582/journal.pjz/2017.49.2.599.607
Kornacki, J. and Ćwik, J., 2005. Statistical learning systems. WNT, Warsaw.
Kovalchuk, I.Y., Mukhitdinova, Z., Turdiyev, T. Madiyeva, G., Akin, M., Eyduran, E. and Reed, B.M., 2017. Modeling some mineral nutrient requirements for micropropagated wild apricot shoot cultures. Pl. Cell Tissu. Organ Cult., 129: 325-335. https://doi.org/10.1007/s11240-017-1180-0
Lawrence, T.L.J. and Fowler, V.R., 2002. Growth of farm animals, 2nd edition. CABI Publishing, Oxon, UK, pp. 347. https://doi.org/10.1079/9780851994840.0000
Legohérel, P., Hsu, C.H.C. and Daucé, B., 2015. Variety-seeking: Using the CHAID segmentation approach in analyzing the international traveler market. Tourism Manage., 46: 359-366. https://doi.org/10.1016/j.tourman.2014.07.011
Liddle, A.R., 2007. Information criteria for astrophysical model selection. Monthly Notic. R. Astron. Soc. Lett., 377: L74-L78. https://doi.org/10.1111/j.1745-3933.2007.00306.x
Milborrow, S., 2011. Multivariate Adaptive Regression Splines: Package ‘earth’ derived from MDA:MARS by Trevor Hastie and Rob Tibshirani. Available at: https://cran.r-project.org/web/packages/earth/earth.pdf (Accessed on 09 February, 2019).
Milborrow, S., 2018. Notes on the earth package. Available at: http://www.milbo.org/doc/earth-notes.pdf (Accessed on 09 February, 2019).
Moaeen-ud-Din, M., Ahmad, N., Iqbal, A. and Abdullah, M., 2006. Evaluation of different formulas for weight estimation in Beetal, Teddi and crossbred (Beetal x Teddi) goats. J. Anim. Pl. Sci., 16: 74-74.
Mohammad, M.T., Rafeeq, M., Bajwa, M.A., Awan, M.A., Abbas, F., Waheed, A., Bukhari, F.A. and Akhtar, P., 2012. Prediction of body weight from body measurements using regression tree (RT) method for indigenous sheep breeds in Balochistan, Pakistan. J. Anim. Pl. Sci., 22: 20-24.
Musa, A.M., Idam, N.Z. and Elamin, K.M., 2012. Regression analysis of linear body measurements on live weight in Sudanese Shugor sheep. Online J. Anim. Feed Res., 2: 27-29.
Orhan, H., Eyduran, E., Tatliyer, A. and Saygici, H., 2016. Prediction of egg weight from egg quality characteristics via ridge regression and regression tree methods. R. Bras. Zootec., 45: 380-385. https://doi.org/10.1590/S1806-92902016000700004
Perez, Z.O., Ybañez, A.P., Ybañez, R.H.D. and Sandoval, J.F.G.J., 2016. Body weight estimation using body measurements in goats (Capra hircus) under field condition. Phillipp. J. Vet. Anim. Sci., 42: 1-7.
Pesmen, G. and Yardimci, M., 2008. Estimating the live weight using some body measurements in Saanen goats. Arch. Zootec., 11: 30-40.
R Core Team, 2014. R: A language and environment for statistical computing. R Foundation for Statistical Computing, 2014. Available at: http://www.R-project.org
Raja, T.V., Venkatachalapathy, R.T., Kannan, A. and Bindu, K.A., 2013. Determination of best-fitted regression model for prediction of body weight in Attappady black goats. Glob. J. Anim. Breed. Genet., 1: 20-25
Takma, C., Atil, H. and Aksakal, V., 2012. Comparison of multiple linear regression and artificial neural network models goodness of fit to lactation milk yields. Kafkas Univ. Vet. Fakul. Derg., 18: 941-944.
Tang, T., Zheng, G., Huang, Y., Shu, G. and Wang, P., 2005. A comparative study of medical data classification methods based on decision tree and system reconstruction analysis. Indust. Engin. Manage. Syst., 4: 102-108.
Tariq, M.M., Eyduran, E., Bajwa, M.A., Waheed, A., Iqbal, F. and Javed, Y., 2012. Prediction of live body weight from testicular and morphological characteristics in indigenous Mengali sheep of Pakistan: Using factor analysis scores in multiple linear regression analysis. Int. J. Agric. Biol., 14: 590-594.
Willmott, C. and Matsuura, K., 2005. Advantages of the mean absolute error (MAE) over the root mean square error (RMSE) in assessing average model performance, Clim. Res., 30: 79-82. https://doi.org/10.3354/cr030079
Yakubu, A., 2012. Application of regression tree methodology in predicting the live body weight of Uda sheep. Anim. Sci. Biotechnol., 45: 484-490.
Yordanova, A., Gocheva-Ilieva, S., Kulina, H., Yordanova, L. and Marinov, I., 2015. Classification and regression tree analysis in modeling the milk yield and conformation traits for Holstein cows in Bulgaria. Agric. Sci. Technol., 7: 208-213.
To share on other social networks, click on any share button. What are these?


