

Characterization of a Novel Recombinant β-Lactamase from Bacillus subtilis R5


Characterization of a Novel Recombinant β-Lactamase from Bacillus subtilis R5
Amjed Ali1, Muhammad Tayyab1*, Abu Saeed Hashmi2, Asif Nadeem3, Shumaila Hanif4, Sehrish Firyal1, Shagufta Saeed1, Ali Raza Awan1 and Muhammad Wasim1
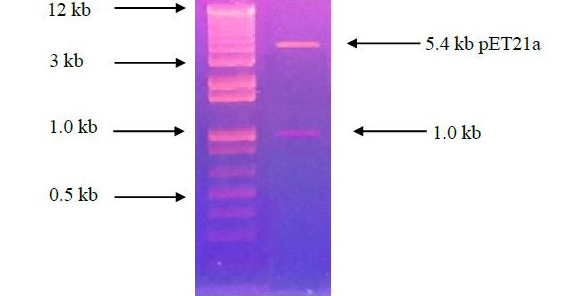
Ethidium Bromide stained agarose gel electrophoresis showing the double digestion analysis of recombinant pET21a harboring β-lactamase gene from Bacillus subtilis R5. Lane 1 shows ladder 1 kb Plus (Invitrogen) while lane 2 shows the restriction digestion of recombinant pTZ57R/T with Nde1 and HindIII.

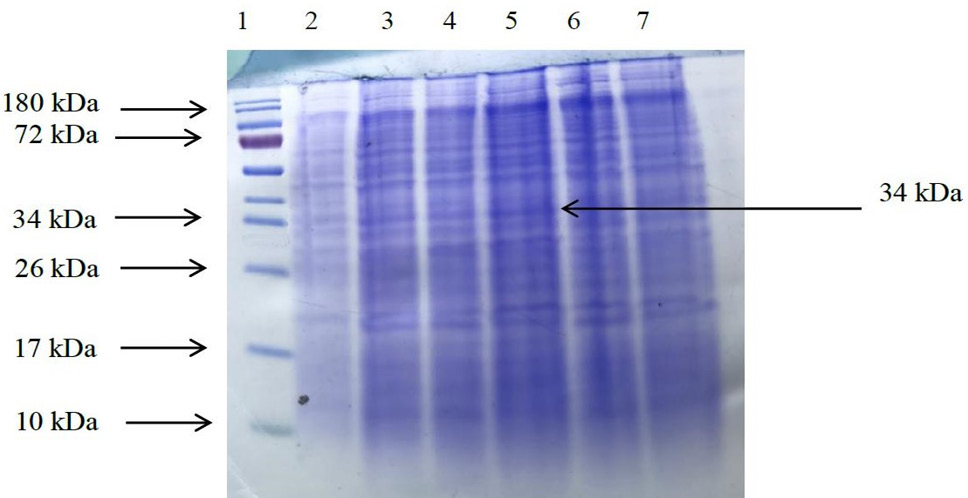
Coomassie Brilliant Blue R250 stained SDS-PAGE gel demonstrating expression of β-lactamse gene with respect to increasing concentration of IPTG; Lane 1: Pre-stained Protein Ladder (Thermo Fisher Scientific); Lane 2: BL21 CodonPlus Cells transformed with pET21a without insert as control; Lane 3, 4, 5, 6, 7 shows the transformed BL21 CodonPlus (DE3) cells having recombinant pET21a induced with 0.2, 0.4, 0.6, 0.8 and 1mM concentration of IPTG, respectively.

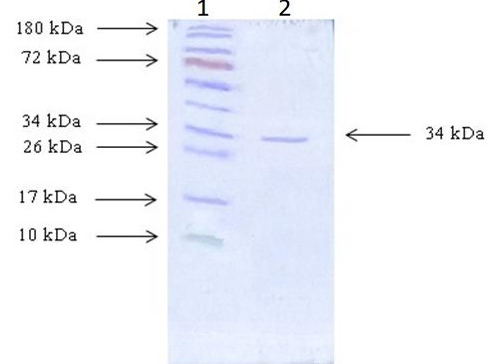
Coomassie Brilliant Blue R250 stained SDS-PAGE gel demonstrates the purity and molecular weight analysis of β-LACBS. Lane 1 is Pre-stained Protein Ladder (PageRuler™, Thermo Fisher Scientific); Lane 2 is purified β-LACBS.

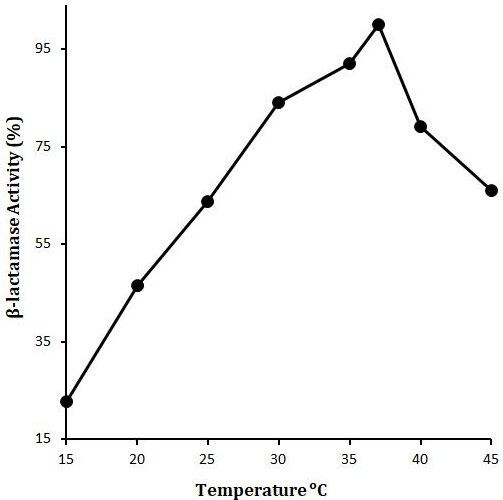
Effect of temperature on LACBS activity. X-axis shows the temperature (OC) while Y-axis shows the LACBS activity (%). Enzyme activity was examined in 50mM sodium phosphate buffer (pH 7) and 5μM Benzylpenicillin as substrate.
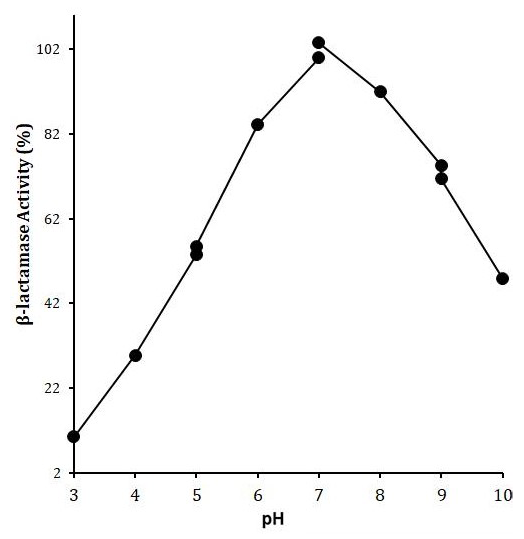
Effect of pH on LACBS activity. X-axis shows the pH while Y-axis shows the LACBS activity (%). Enzyme activity was examined in 50 mM of each of sodium acetate buffer (pH 3-5), Sodium phosphate buffer (5-7), Tris-HCl buffer (7-9) and Glycine/NaOH buffer (9-10) using benzylpenicillin (5μM) as a substrate.
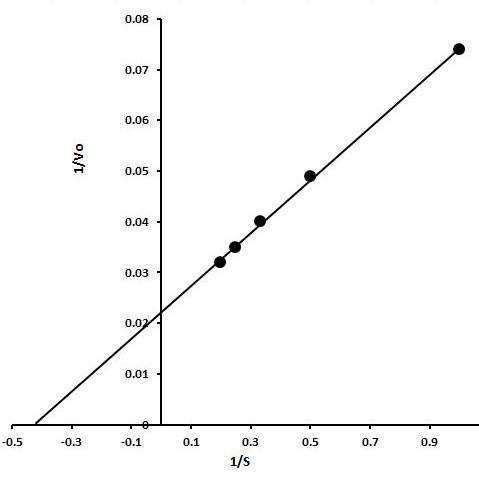
Lineweaver-Burk plot for the estimation of kinetic parameters. X-axis shows 1/substrate concentration whereas Y-axis shows 1/enzyme velocity.


