
Assessment of Farmers’ Vulnerability to Climate Change in Agro-Climatic Zones of Pakistan: An Index Based Approach


Research Article
Assessment of Farmers’ Vulnerability to Climate Change in Agro-Climatic Zones of Pakistan: An Index Based Approach
Shumaila Sadiq1,2*, Abdul Saboor2, Fouzia Jamshaid3, Abdul Qayyum Mohsin2 and Azeem Khalid2
1Department of Economics, The Government Sadiq College Women University, Bahawalpur, Pakistan; 2Department of Economics, PMAS Arid Agriculture University, Rawalpindi, Pakistan, 3Department of Economics, Allama Iqbal Open University, Islamabad, Pakistan.
Abstract | Climate change is hurting human lives by having physical as well as psychological impacts that has significantly affected their livelihood. This study predominantly targeted farming community to determine farmers’ climate change vulnerability index among 9 agro-climatic zones of Pakistan by using data sets from PMD (1981-2010) and HIES (2010-11). Findings revealed that farmers in KPK and Balochistan were the most while farmers in Mixed Punjab and Cotton-Wheat Sindh were the least vulnerable to climate change. In depth analysis of variables of sub-indices suggested that weather related hazards, coupled with extreme cold and hot months were much higher in Punjab. Drought impact was found higher in KPK and Balochistan followed by Sindh. Increasing share of small farmers and food insecure population also resulted in an increase in the sensitivity of farming community almost in all agro-climatic zones. Poor farm economy and lack of education were identified as main causes of low adaptive capacity. The small farmers were found inefficient with the changing environment so they may be encouraged for cooperative farming. Climate change vulnerability monitoring may be beneficial for policy makers in policy formulation and implementation processes to develop zone specific sustainable adaptation strategies particularly to improve farmers’ food security, economic situation and education in Pakistan.
Received | September 19, 2017; Accepted | April 05, 2019; Published | June 27, 2019
*Correspondence | Shumaila Sadiq, Department of Economics, The Government Sadiq College Women University, Bahawalpur, Pakistan; Email: shumaila.sadiq@gscwu.edu.pk
Citation | Sadiq, S., A. Saboor, F. Jamshaid, A.Q. Mohsin and A. Khalid. 2019. Assessment of farmers’ vulnerability to climate change in agro-climatic zones of Pakistan: An index based approach. Sarhad Journal of Agriculture, 35(3): 734-740.
DOI | http://dx.doi.org/10.17582/journal.sja/2019/35.3.734.740
Keywords | Climate change, Vulnerability index, Agro-climatic zones, Exposure, Sensitivity, Adaptive capacity
Introduction
Climate change is impacting agricultural productivity, food security and livelihoods of the people. The observed impacts of climate change on agriculture sector are found to be negative in most of the regions of the world. Particularly, major crops including wheat, rice and maize has been negatively affected from climate change. Climate change is not only affecting the agricultural production systems but it is also effecting physical infrastructure and social arrangements. It is affecting physical and psychological health as well as livelihood of human being. Adverse impacts of climate change may increase cost of living, aggravate rural poverty and resultantly other socio-economic indicators (IPCC, 2014). It is well argued that poorest and marginalized communities from poor countries are the most vulnerable to climate change (World Bank, 2009).
South Asia is identified as the second poorest performer after Sub-Saharan Africa in Human Development Indicators (HDI) (UN, 2009) that is due to higher dependency on natural resources such as water, coastal areas, rangelands, agricultural land and forests that are degrading over time due to climatic and natural calamities (IPCC, 2014). In South Asia, Pakistan is ranked 3rd among 5 most vulnerable countries to climate change (GCRI, 2015). Drastic variability in environmental factors has posed a serious threat to agriculture growth and consequently economic growth of country as the sector serves as base for industrial and trade sectors by providing raw materials (GOP, 2015). Pakistan’s more than 60 percent of the population depends on agriculture and sectors depending upon agriculture. In Pakistan, marginal and small farmers (landholding< 5 acres), and landless laborers and tenants, accounting for 70 percent of farmers’ population, are the most vulnerable groups to climate change induced impacts, particularly in fragile zones (LEAD, 2008). Large proportion of vulnerable farmers to climate variability heavily depend on natural resources with limited capacity to cope with climate change induced impacts (IPCC, 2001; Heltberg and Osmolovskiy, 2011; Malik et al., 2012).
The concept of climate change vulnerability has gained considerable attention in recent decades throughout the world by climate change researchers and policy makers because the developing countries are primarily vulnerable to adverse impacts of climate change. The developed countries are called upon to assist developing countries in meeting the cost of adaptation to combat the adverse impacts of climate change (UN, 1992). Vulnerability is the risk of facing some deprivation during a particular time interval. Many indices have been developed worldwide that determine the climate change vulnerability at local, national and international levels. For example, United Nations Framework Convention on Climate Change (UNFCC) evaluates human vulnerability to climate change in accordance with IPCC definition of climate change vulnerability that defines the vulnerability as combination of sensitivity and adaptive capacity to climate change and probability of adverse climate change. The UNFCC integrates the quantitative and qualitative mixture of information in context of HDI. The UNFCC index is equally supportive at local, national and global level. It is helpful to identify and target the most vulnerable population, sectors or regions to contribute to an effective monitoring strategy (UNFCC, 2015). Maplecroft’s national level Climate Change Vulnerability Index (CCVI) evaluates 42 environmental and socio-economic factors annually for 170 countries to identify and categorize world economies by global advisory firm (Maplecroft, 2011). Similarly, Garman Watch’s Global Climate Risk Index (GCRI) is a country index by university of Notre Dame Global Adaptation Index (ND-GAIN).
In view of these country indices, regional indices to climate change vulnerability are also part of scientific debates. Hahn et al. (2009) evaluated climate change vulnerability by developing Livelihood Vulnerability Index (LVI) in two districts of Mozambique-Moma and Mabote. The same LVI index was applied in Northern Ghana to estimate small farmers’ vulnerability to climate change (Etwire et al., 2013). Following Hahn et al. (2009), Coastal Community Vulnerability Index (CCVI) explored the vulnerability of Philippines’ coastal communities by using weighted average of major indicators (Orencio and Funnji, 2013). Heltberg and Osmolovskiy (2011) also developed an index for agro-climatic zones of Tajikistan following IPCC definition of vulnerability to map regional vulnerability of climate change to human. This study aggregated the environmental, social and economic factors to evaluate the vulnerability index passing through estimation of its sub-domains including exposure, sensitivity and adaptive capacity.
Malik et al. (2012) examined the human health vulnerability to climate change in Pakistan’s context following the indexing methodology of Heltberg and Osmolovskiy (2011) across agro-climatic zones. The study in hand however precisely centers the Farmers’ Vulnerability to Climate Change (FVCC) in Pakistan. This study is unique in the sense that it is developing a FVCC index across agro-climatic zones for the first time in Pakistan to identify the most vulnerable zone for farming community. This study has distinctive importance that conclusions drawn from vulnerability disaggregation across regions can be helpful to plan especially pro-poor adaptation strategies for farming community in Pakistan.
Materials and Methods
Following Heltberg’s and Osmolovskiy’s (2011) CCVI, this study developed a FVCC index by estimating its three sub-indices of sensitivity, exposure and adaptive capacity in accordance to IPCC (2001) definition of vulnerability. Exposure and sensitivity are directly while adaptive capacity is inversely related to the FVCC index.
 …(1)
…(1)
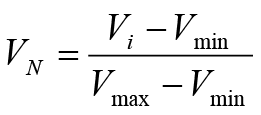
The sub-indices of Exposure (E), Sensitivity (S) and Adaptive Capacity (AC) are all calculated by using non-weighted averages of estimated normalized variables. All variables in three sub-indices were normalized first in to 0-1 interval by linear transformation:
 …(2)
…(2)
Where;
VN is normalized variable, Vi is the observed value while Vmax and Vmin are maximum and minimum values within sample range.
Sub-index of exposure
Exposure to climate variability is determined by weather related events including long term (at least of 30 years) variations in temperature and precipitation, frequency of weather related natural disasters and extreme weather events like floods, droughts, frequency of extreme hot and cold days or months, etc. Seven main indicators were used to measure the exposure to climate change, mathematically:

Where;
E1-E12: Standard deviation of average temperature in month I; E13-E24: Standard deviation of total precipitation in month I; E25-E36: Range between maximum and minimum average temperature in month I; E37: Frequency of extremely hot months; E38: Frequency of extremely cold months; E39-E66: Palfai Drought Index temporal average over the period; E67: Frequency of weather related disasters between 1981-2010; All variables E1-E38 are calculated from PMD data over the period 1981-2010, E39-E66 is estimated Palfai Drought Index for the period 1983-2010 while E67 was inquired from various issues of GOP (2015) and OCHA (2015).
Sub-index of sensitivity
Sensitivity refers to the reliance of population on natural resources for their livelihood, health status, poverty, demographic structure and disaster related sensitivity. Climate variability has adverse impacts on farmers’ livelihood, health, food security etc. To determine farmers’ sensitivity to climate variability, sub-index of sensitivity used indicators from agriculture, health, poverty, hunger and demographic variables. Eight indicators were used to estimate sensitivity sub index. Agriculture sensitivity to climate change impacts is measured by 3 indicators (S1-S3), 2 indicators of demographic sensitivity (S4-S5) and 2 indicators to quantify the adverse impacts of climate change on farmers’ health (S6-S7). While share of food insecure population was considered best to measure sensitivity of farmers to hunger and poverty. Mathematically:

Where;
S1: Negative of the amount of irrigated land; S2: Share of small farmers (farmers with less than or equal to 5 acres of land); S3: Share of crop income in total income; S4: Share of population below 5 years of age; S5: Share of population above 65 years of age; S6: Percentage of children under 5 suffering from diarrhea; S7: Share of population without access to safe water sources (piped, motor and pump is taken as safe water, all other sources are unsafe water sources); S8: Share of population that is food insecure; The data for all the variables from S1-S7 were extracted from HIES 2010-11 (GOP, 2010) except S8 that is collected from FSA (2009).
Sub-index of adaptive capacity
Adaptive capacity is the ability of people to adapt to circumstances produced by climate change. It is measured by various socio-economic conditions such as per capita consumption of households, literacy rate, employment rate, institutional arrangements etc. of the inhabitants exposed to climate variability. This study used 11 indicators to measure adaptive capacity to climate change. The farmers’ economic situation (farmer economy) is represented by 2 indicators (AC1-AC2), land tenure is defined by 2 indicators (AC3-AC4), farms status is constructed from 2 indices (AC5-AC6), three variables were used to estimate the composite index of access to information (AC9) including radio, television and mobile. The index of access to health facilities was estimated from 2 indicators (AC10-AC11) and integrated agriculture index (AC6). Various farm level agriculture practices including production of crops, feed and others, fruits and vegetables, livestock and poultry were considered to construct integrated agriculture index. Mathematically:

Where;
AC1: Household per capita expenditures; AC2: Current economic situation in comparison to previous year (1 if improved, 0 if not improved); AC3: Land owned in acres; AC4: Land tenure (1 if owner of the land, 0 if owner cum tenant); AC5: Farm mechanization index (1 if farmer owns agriculture asset); AC6: Integrated agriculture index (1 if 2 or more agriculture practices exist at farms); AC7: Share of population employed; AC8: Share of population with higher education (above secondary); AC9: Access to information index (a composite index from radio, television and mobile); AC10: Percentage of children below 5 years immunized against major diseases; AC11: Percentage of births attended by trained/ skilled birth attendants; The data for all the variables were taken from HIES 2010-11.
Farmers’ vulnerability to climate change index
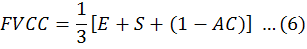
The FVCC index is the composite index, estimated by using simple non-weighted average of all three sub-indices of exposure, sensitivity and negative of the adaptive capacity (Heltberg and Omolovskiy, 2011).
Results and Discussions
The study redefined 12 agro-climatic zones of Pakistan. Pickney (1989) defined 9 agro-climatic zones. Following his classification, same districts have been used in this study for 9 agro-climatic zones but extended them to 12 zones by including Gilgit Baltistan (GB), Federally Administered Tribal Areas (FATA), Azad Jammu and Kashmir (AJK). District classification by agro-climatic zones is provided (Table 1, Figure 1).
The study developed FVCC index to categorize farmers’ vulnerability across 9 agro-climatic zones in Pakistan excluding GB, FATA and AJK because of lack of agriculture practices and data availability for these zones. The examined FVCC index found that farmers were not equally vulnerable across all agro-climatic zones. For instance, farmers in Khyber Pakhtun Khwah (KPK) were found the most vulnerable while in Cotton-Wheat Sindh and Mixed Punjab were the least vulnerable. However, farmers’ extent of vulnerability to climate change was moderate in Rice-Wheat Punjab and Rainfed Punjab and Islamabad among 9 agro-climatic zones (Figure 2).
Table 1: Districts and met stations classification by agro-climatic zones.
| Agro-climate zone | Districts classification | |
| 1 | Rice-Wheat Punjab | Sialkot, Gujrat, Gujranwala, Sheikhupura, Lahore, Kasur, Narowal*, Mandi Bahauddin*, Hafizabad*, Nankana Sahib* |
| 2 | Mixed Punjab | Sargodha, Khushab, Jhang, Faisalabad, Toba Tek Singh, Okara, Chiniot* |
| 3 | Cotton-Wheat Punjab | Sahiwal, Bahawalnagar, Bahawalpur, Rahimyar Khan, Multan, Vehari, Lodhran*, Khanewal*, Pakpatan* |
| 4 |
Low-Intensity Punjab-KPK |
Dera Ghazi Khan, Rajanpur, Muzaffargarh, Layyah, Mianwali, Bhakkar from Punjab and Dera Ismail Khan from Khyber Pakhtoon Khwah |
| 5 |
Rain-Fed Punjab-Islamabad |
Attock, Jehlum, Chakwal*, Rawalpindi and Islamabad |
| 6 | Cotton-Wheat Sindh | Sukkur, Khairpur, Nawabshah, Hyderabad, Tharparkar, Nowshero Feroz*, Ghotki*, Umerkot*, Mirpur Khas*, Sanghar*, Matiari*, Tando Allah Yar* and Tando Muhammad Khan* |
| 7 |
Rice-Other Sindh-Balochistan |
Jacobabad, Larkana, Dadu, Thatta, Badin, Shikarpur, Kashmore*, Shehdad Kot*, Jamshoro*and Karachi from Sindh, Nasirabad and Jafarabad* from Balochistan |
| 8 | Other KPK | All Khyber Pakhtoon khawh except Dera Ismail Khan |
| 9 | Other Balochistan | All Balochistan except Nasirabad and Jafarabad* |
| 10 | Gilgit Baltistan | All GB |
| 11 | FATA | All Agencies and FATA Regions |
| 12 | AJK | All AJK |
Source: Pickney (1989), Asian Development Bank (2005), PMD and GOP; * The districts with * were created from 1989-2010. The new districts were integrated in the respective agro-climatic zones according to their parent districts; * North-West Frontier Province (NWFP) was named afterwards Khyber Pakhtoon Khwah (KPK); * Gilgit Baltistan, FATA and AJK (disputed territory) were incorporated to represent entire region.
Extent of farmers’ vulnerability is governed by the magnitude of exposure, sensitivity, adaptive capacity and the indicators used in these three sub-indices. Results indicated that farmers in Other KPK were experiencing the highest exposure to climate variability followed by Rice-Other Sindh and Balochistan and Other Balochistan. While farmers in Low-Intensity Punjab, Cotton-Wheat Punjab and Rice-Wheat Punjab were experiencing comparatively less and almost same level of exposure (Figure 3).
Further examination of exposure determined that weather related disasters, frequency of extreme cold and hot months and range of mean temperature were main causes to push the exposure (Figure 4a). However, farmers in Cotton-Wheat Sindh and Mixed Punjab were experiencing the lowest exposure to climate change (Figure 3) as a result of low tendency of weather related disasters in spite of extreme exposure to hot and cold months (Figure 4a). Rainfed-Punjab and Islamabad had the highest level sensitivity to climate variability followed by Other Balochistan, Other KPK and Low-Intensity Punjab respectively. Rice-Wheat Punjab, Rice-Wheat Sindh and Balochistan were ranked the least sensitive after Cotton-Wheat Punjab, Cotton-Wheat Sindh and Mixed Punjab (Figure 3). Zonal sensitivity was depending upon two major factors in all agro-climatic zones including share of small farmers and share of food insecure population along with other factors having small contribution towards sensitivity. These two contributing factors are mainly playing decisive role in ranking of zonal sensitivity (Figure 4b).
The study could not establish much discrepancy among various agro-climatic zones in adaptive capacity. However, Cotton-Wheat Punjab is ranked as highest and Other Balochistan is ranked as lowest in adaptive capacity. Other ranking from top to bottom is as follows. Cotton-Wheat Sindh and Rice-Wheat Sindh and Balochistan followed by Low-Intensity Punjab and KPK, Rice-Wheat Punjab and Rainfed Punjab and Islamabad, mixed Punjab and Other KPK (Figure 3). By exploring the ingredients of adaptive capacity, the study found that farmers’ economic situation is best in Cotton-Wheat Sindh followed by Rainfed Punjab and Rice-Other Sindh and Balochistan and worst in Low-Intensity Punjab and KPK. Farmers land tenure status is found highest in Cotton-Wheat Sindh, Rice-other Sindh and Balochistan and Rainfed Punjab and Islamabad means most of the farmers are land owners and per acre land holding is much higher in these regions while it is lowest in Mixed Punjab and Cotton-Wheat Punjab. While farm status is found as highest in KPK and Low-Intensity Punjab and KPK meaning integrated farming and farm mechanization is more in this area while it is lowest in Other Balochistan. The dearth of access to information was examined in Rainfed Punjab and Islamabad in contrast to Other Balochistan and Low-Intensity Punjab and KPK. Rainfed Punjab and Islamabad are ranked as highest in share of highly educated population while Low-Intensity Punjab and KPK are ranked at the lowest. Health facilities are significantly lowest in Other Balochistan and Other KPK in comparison to other zones (Figure 4c).
Conclusions and Recommendations
This study developed the composite index of FVCC to identify the reasons behind the extent of vulnerability in agro-climatic zones in Pakistan. The study found that farmers were not equally vulnerable across all 9 agro-climatic zones and their vulnerability was highly dependent upon the factors included in sub-indices. Vulnerability among zones is found different in exposure, sensitivity and adaptive capacity for diverse reasons. The study found that most important contributors are weather related disasters and frequency of extreme cold and hot months in exposure while share of small farmers and share of food insecure population are main causes of high sensitivity almost in all zones. The small farmers were efficient in the past but now they are found incompatible with the changing environment. So cooperative farming may be useful suggestion to reduce the sensitivity to climate change. Likewise, some measures are required to reduce the share of food insecure farming community particularly in KPK and low intensity Punjab and funds can be transferred to these regions to reduce climate change vulnerability. The study also suggested to improve farmers’ economic situation and access to higher education to improve adaptive capacity. Since, monitoring vulnerability of agriculture community, through in depth analysis of sub dimensions, make it possible to increase overall adaptive capacity by reducing exposure and sensitivity to feel the farmers in Pakistan less vulnerable.
Novelty Statement
This study is unique in the sense that it developed the Farmers’ Vulner-ability to Climate Change (FVCC) Index across agro-climatic zones to identify the most vulnerable zones among farming community in Paki-stan. This is first such kind of work which has been done in Pakistan. Indexing procedure is also unique which was done in the agro-climatic zones of Pakistan. The case of small farmers adopted in the research narratives is also a significant feature of this study. The results can be helpful to plan especially pro-poor adaptation strategies for the coun-try’s farming community.
Author’s Contribution
This research is part of PhD Dissertation that was undertaken under the kind supervision of AS while AQM and AK guided the corresponding author at every step. FJ took part in the review and formatting of the paper. All authors read and approved the final manuscript.
References
Etwire, P.M., R.M.A. Hassan, J.K.M. Kuwornu and Y.O. Owusu. 2013. Application of livelihood vulnerability index in assessing vulnerability to climate change and variability in Northern Ghana. J. Enviorn. Earth Sci. 3(2):157-170.
FSA. 2009. Food Security in Pakistan. SDPI, SDC and WFP.
GCRI. 2015. Global Climate Risk Index 2015: Who suffers most from extreme weather events? German watch. www.germanwatch.org
GOP. 2015. Pakistan economic survey. Economic advisor’s wing, finance division, ministry of finance, Pakistan.
GOP. 2010. House hold integrated survey. Federal bureau of statistics, Pakistan.
Hahn, M., A. Reiderer and S. Foster. 2009. The livelihood vulnerability index: A pragmatic approach to assessing risks from climate variability and change-A case study in Mozambique. Glob. Environ. Change. 19: 74-88. https://doi.org/10.1016/j.gloenvcha.2008.11.002
Heltberg, R. and M.B. Osmolovskiy. 2011. Mapping vulnerability to climate change. World Bank Policy Paper No. WPS 5554.
IPCC. 2001. Climate change 2001: Synthesis report. 3rd Assessment report of IPCC.
IPCC. 2014. Asia. In: Climate change 2014: Impacts, adaptations and vulnerability. Working group II to the 5th Assess. Rep. of IPCC. 1327-1370.
LEAD. 2008. Pakistan’s options for climate change mitigation and adaptation. Scoping Study Rep. Br. High Comm. Islamabad.
Malik, S.M., H. Awan and N.U. Khan. 2012. A study of the effects of climate change on human health in Pakistan: Evid. Based Policy Advocacy.
Maplecroft’s Climate Change Risk Atlas. 2011. Climate change vulnerability index. https://maplecroft.com/about/news/ccvi.html
OCHA. 2015. Natural disasters of Pakistan. 1935-2011. http://www.pakresponse.info
Orencio, P.M. and M. Funnji. 2013. An index to determine vulnerability of communities in a coastal zone: A case study of Baler, Aurora, Philippines AMBIO. 42: 61-71. https://doi.org/10.1007/s13280-012-0331-0
Palfai, I. and A. Herceg. 2011. Drought of hungry and Balkan Peninsula. Hazards and Disasters. 10(9):145-154.
Pickney, T.C. 1989. The demand for public storage of wheat in Pakistan. Research Report 77. International Food Policy Research Institute, Washington, D.C.
PMD. 2015. http://www.pmd.gov.pk/Observatories/index.html
UNFCC. 2015. Compendium on methods and tools to evaluate impacts of and vulnerability and adaptation to climate change. http://unfccc.int/adaptation/nairobi_work_programme/knowledge_
resources_and_publications/items/5506.php
UN. 1992. United Nations framework convention on climate change. https://unfccc.int/resource/docs/convkp/conveng.pdf.
UN. 2009. The millennium development goals report 2009. U.N. Dep. Econ. Soc. Aff. (UN DESA) Stat. Div. New York, NY, USA.
World Bank. 2009. World development report: Reshaping economic geography, OUP. The World Bank, Washington, DC, USA.
To share on other social networks, click on any share button. What are these?


