

Application of Non-Equilibrium SPMs to Access Overexploitation Risk Faced by Scomberomorus sinensis in Shandong, China


Application of Non-Equilibrium SPMs to Access Overexploitation Risk Faced by Scomberomorus sinensis in Shandong, China
Muhammad Mohsin1, Yin Hengbin2,* and Zhang Luyao3
1College of International Finance and Trade, Zhejiang YueXiu University of Foreign Languages, Shaoxing, 312000, China
2Marine Resource Management, School of Finance and Trade, Wenzhou Business College, Wenzhou, 325035, China
3Strategic Management, School of Business, Hanyang University, Seoul, 04763, Korea
ABSTRACT
The fishing industry of the China is the largest in world which is usually believed to be facing overexploitation risk. In this condition, it becomes necessary to estimate stock status of fishery resources particularly having commercial importance. Thus, this study is the first time attempt to know whether Spanish mackerel, a major landed fishery resource in Shandong, China, is experiencing overexploitation or not by estimating its stock status. For this purpose, long data series, 2006-2016, comprised of catch and effort figures was statistically analyzed to know maximum sustainable yield (MSY) of this resource and its ongoing regime. In total, three surplus production models (SPMs) were used in this study, viz., Fox (FM), Schaefer (SM) and Pella-Tomlinson (PTM) with the help of two famous fishery statistical routines, viz., catch and effort data analysis (CEDA) and a stock production model incorporating covariates (ASPIC). For initial proportion (IP) 1, CEDA estimated MSY in a range between 41000-50000 t, whereas, ASPIC calculations remained between 44000-52000 t. Furthermore, results also showed that fishing mortality (F) is increasing while biomass (B) is swiftly decreasing. Based on the results it can be concluded that Spanish mackerel is facing the risk of overexploitation. Thus, it is recommended to make such policies which can conserve this fishery resource for future.
Article Information
Received 01 September 2019
Revised 12 January 2020
Accepted 11 March 2020
Available online 08 January 2021
Authors’ Contribution
MM and YH initiated this project, performed statistical analysis and wrote the manuscript. ZL procured data, constructed tables and figures and revised several parts of the manuscript.
Key words
Spanish mackerel, Overexploitation risk, CEDA, ASPIC, China.
DOI: https://dx.doi.org/10.17582/journal.pjz/20190901040914
* Corresponding author: 20190251@wzbc.edu.cn
0030-9923/2021/0002-0439 $ 9.00/0
Copyright 2021 Zoological Society of Pakistan
Introduction
China has a wide range of marine fisheries which supports wide variety of the coastal community of fishermen that are native to the country. There are more than thousands of marine species in China, Chinese seerfish, Scomberomorus sinensis (Lacepede 1800), is among the major fishery resources unloaded on the landing sites along the coast of Shandong (China Fisheries Yearbook, 2017). China is the world’s leading exporter of fish. It has high economic value in Chinese market and fetches huge profits to the fishermen. It is utilized in various forms for example as dried, fresh, smoked, boiled, fried and baked (Frimodt, 1995). The reported capture production of this fishery resource from Shandong in 2003 and 2016 was 170389 MT and 168456 MT, respectively (China Fisheries Yearbook, 2017). This indicates that recently capture production of this important fishery resource is started to decline. Extensive fishing and commercially exploitation has resulted in a decline of most of these species in their native habitats leaving some at a risk of extinction.
Currently, Chinese seerfish appears extremely rare in the China and this species has been also listed on IUCN Red List (Collette et al., 2011). Although there are laws that regulate fishing in particular fisheries, much needs to be done regarding research to identify the distribution, population sizes, threats, and conservation measures appropriate for China’s fish species as most of these are classified as data deficient. Enforcement of existing laws is also necessary to the achievement of conservation goals.
Scombridae family, generally known as the mackerel family (Collette et al., 2011), and believed the world’s fastest swimming fish; especially, some smaller mackerel stay close to the shoreline while many others remain in deeper waters. This family is represented by about 15 genera and 54 species of fish in marine water bodies of the world (Fricke et al., 2019). Chinese mackerel S. sinensis (Lacépède, 1800) is also known as Chinese seerfish (Robins et al., 1991) and its English name, commonly known as Chinese seerfish worldwide (FAO-FIES, 2018).
It is a ray-fin-shaped bony fish belongs to class Actinopterygii and genus Scomberomorus (FishBase, 2019). Unambiguously, this fish is a member of Scomberomorini tribe; originated in the western Pacific, but also enters the Mekong River (Collette et al., 2011). The Chinese seerfish lives in the diverse aquatic habitat such as pelagic-neritic, freshwater, brackish and marine environment at 10 meter depth range zone (Collette et al., 1983). This enormous Chinese seerfish (S. sinensis) species is amphidromous in nature and is a voracious predator and can be found in small schools. A very little is known about this pelagic predator and no information on biology is available (Collette, 2001), but believed to reproduce only in marine waters (Rainboth, 1996). It reaches at the maximum length of 247 cm (2.47 meter) in total length (TL) (IGFA, 2009), and the common size of length at 100.0 cm (1 meter) total length (Herklots and Lin, 1940), while the published weight extents 131.00 g (IGFA, 2009), primarily caught by gillnet fleets in Chinese coastal waters.
In particular, the conservation and sustainable use of oceans, seas and marine resources for sustainable development, food and agriculture are the keys factors to achieving the total population directly involved in fisheries and aquaculture. Human society now faces the enormous challenge of providing food and livelihoods to the current global population. The global momentum in the world of fisheries and aquaculture highlights the specific goal of ending illegal, unreported and unregulated (IUU) fishing industry by 2020 (FAO, 2018). Successfully combating fisheries against IUU fishing and supporting long-term conservation and sustainable use of marine living resources will be a turning point in the future. Economically, to know the current status of the stocks of the fish species, the stock assessment provides baseline information to the fishery managers about the status of fisheries stocks according to inputs for development and sustainable management (Alverson and Paulik, 1973).
Moreover, several studies declare that Chinese marine fishing fleets are overcapitalized (Mu et al., 2007). Thus, it is the need of the hour to understand bioeconomic and management aspects of this important fishery resource. However, previously published literature is devoid of such studies. This study is the first attempt to comprehensively describe bioeconomic and management aspects of a very important fishery resource viz., S. sinensis. It employs a famous fishery model known as Gordon-Schaefer Model applied to data collected from Shandong, China. This study aims to estimate various harvest levels along with their corresponding effort levels to fully understand the mechanisms of ongoing bioeconomic, cost and revenue as well as management, exploitation status, implications. It is expected that this study will give direction to manage S. sinensis fishery resource biologically as well as economically.
Materials and methods
Data acquisition
In this study, catch statistics, 2006-2016, of Spanish mackerel caught from Shandong, China were statistically analyzed by using non-equilibrium surplus production models (SPMs). Catch and effort were taken in the form of tons (t) and number of fishermen, correspondingly.
Data analysis
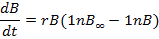
In total, three SPMs, viz., Fox model (FM), Schaefer model (SM) and Pella-Tomlinson model (PTM) were employed. Among these three SPMs, SM is the most frequently employed model in field of fishery sciences. This model uses logistic increase in fish population and is expressed mathematically as follows (Schaefer, 1954):

Where, B, r, t and B∞ represent fish stock biomass, growth rate, time and carrying capacity in that order. In contrast to SM, FM and PTM rely on growth formula proposed by Gompertz and generalized production formula, respectively. These two models are represented as follows (Fox, 1970; Pella and Tomlinson, 1969):
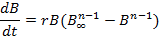
Where, n is the shape parameter. SPMs were applied to the data through famous fishery software, viz., CEDA (catch and data analysis) (Hoggarth et al., 2006) downloaded from MRAG, UK and ASPIC (a stock production model incorporating covariates) (Prager, 2005) downloaded from NOAA fisheries, USA. In CEDA, three error assumptions (EA), viz., normal error assumption (NEA), log-normal error assumption (LNEA) and gamma error assumption (GEA) were used for all of the three models described above. On the other hand, in ASPIC, only two models were used, viz., FM and SM or logistic model (LM).
CEDA (version 3.0.1)
CEDA is a specialized computer based statistical routine which is used for analyzing catch statistics and gives estimate about the current fish stock and unexploited stock sizes and other important fishery parameters. This software uses bootstrapping method and 95% confidence interval. In order to compute parameters, first, initial proportion (IP) was estimated by dividing initial catch with the highest catch. Later on, other IP values, 0.5 – 0.9, were also used to comprehensively understand the stock status of Spanish mackerel in China. IP values 0–1 reflect the state of the fishery. For zero IP value, fish stock is believed to be virgin. On the other hand, for one IP value, fish stock is considered to be fully exploited. In this study IP value was 1, thus, it is not rational to use IP values near 0 such as 0.1, 0.2 etc. The reason for this is that fishery is not virgin; therefore, we used IP values from 0.5 to 1 to estimate MSY. Such kind of analysis is known as sensitivity analysis. Key fishery parameters computed by CEDA are maximum sustainable yield (MSY), carrying capacity (K), catchability coefficient (q), growth rate (r), goodness of fit (R2) and current biomass (B).
ASPIC (version 5.0)
Like CEDA, ASPIC can also compute important fishery parameters and is frequently used in fishery management studies. It requires IP values for parameter estimation. This software runs two types of files, viz., FIT and BOT. FIT and BOT actually refers to different program modes of ASPIC. During FIT mode, ASPIC estimates management parameters, whereas, during BOT mode bootstrapping method by using confidence interval is used. Therefore, the running time of BOT mode is much longer than FIT mode. Moreover, during ASPIC analysis 500 trials were set to estimate parameters. Sensitivity analysis was also performed in CEDA. Alike CEDA, in order to compute MSY with ASPIC separate files for each IP value, i.e., 0.5-1 was prepared. Fishery parameters computed by using this software are MSY, K, q, R2, fishing mortality (F), fishing mortality at MSY (FMSY), biomass at MSY (BMSY), ratio of fishing mortality to fishing mortality at MSY (F/FMSY) and ratio of biomass to biomass at MSY (B/BMSY).
It is necessary to mention that the purpose of using more than one surplus production model in this study is to ensure the reliability of results. In order to find best fit, models were compared on the basis of results by considering four parameters. First, results having R2 value higher than 0.5 were considered only. Second, results with suitable coefficient of variation (CV) value were accepted. Third, for CEDA, graphs obtained for observed and expected catch were also observed to know fitting of the model. Four, too large or very small MSY values were not considered.
Results
This section presents the results obtained during this study. Different types of trends in the trends in the catch statistics were observed. First, catch is swiftly decreasing. Reported figures indicate that catch of Spanish mackerel has considerably decreased from 2006 (155726 t) to 2016 (62568), however, the average catch remained 94898 t/year during the study period. Second, in contrast to catch, effort, i.e., number of fishermen has increased from 2006 (901854) to 2016 (1030730) (Fig. 1). Third, calculated CPUE (catch per unit effort) showed declining trend. In 2006, the estimated CPUE was 0.173 which gradually decreased and in 2016 its value was computed as 0.061 (Fig. 2). Graphs obtained by using CEDA are presented in Figure 3. These graphs are between observed and expected catches which superficially look alike. However, all of the graphs are different with respect to their catch values.
CEDA estimates
As aforementioned, in this study SPMs were applied to data with the help of two statistical routines, viz., CEDA and ASPIC. The results obtained by these software are presented in the form of tables. Table I present CEDA estimates of MSY by using different IP values (0.5-1). In sensitivity analysis, CEDA computed higher MSY estimates against lower IP values and vice versa.
Table I.- Estimated MSY values for Spanish mackerel in Chinese marine waters by using CEDA (IP = 0.5-1).
|
IP |
Model |
||||||||
|
FM |
SM |
PTM |
|||||||
|
NEA |
LNEA |
GEA |
NEA |
LNEA |
GEA |
NEA |
LNEA |
GEA |
|
|
0.5 |
59752 |
70667 |
62156 |
91050 |
84812 |
92890 |
91050 |
84812 |
92890 |
|
0.137 |
0.065 |
0.146 |
0.096 |
0.018 |
0.093 |
0.105 |
0.014 |
0.093 |
|
|
0.6 |
53656 |
53549 |
55879 |
74866 |
79182 |
MF |
74866 |
79182 |
MF |
|
0.146 |
0.135 |
0.148 |
0.154 |
0.029 |
0.149 |
0.031 |
|||
|
0.7 |
49239 |
52310 |
51312 |
63393 |
62241 |
MF |
63393 |
62241 |
MF |
|
0.167 |
0.157 |
0.156 |
0.180 |
0.103 |
0.172 |
0.101 |
|||
|
0.8 |
45865 |
47617 |
MF |
54733 |
62894 |
58258 |
54733 |
62894 |
58258 |
|
0.184 |
0.179 |
0.195 |
0.110 |
0.189 |
0.189 |
0.099 |
0.191 |
||
|
0.9 |
43244 |
45096 |
MF |
47960 |
53248 |
51270 |
47960 |
53248 |
51270 |
|
|
0.191 |
0.178 |
0.224 |
0.173 |
0.221 |
0.216 |
0.177 |
0.216 |
|
|
1 |
41127 |
44035 |
42978 |
42543 |
49222 |
MF |
42543 |
49222 |
MF |
|
0.213 |
0.189 |
0.193 |
0.258 |
0.239 |
0.232 |
0.208 |
|||
CV, coefficient of variation (written below MSY values); MF, minimization failure.
For instance, by using IP value of 0.5 this software computed MSY as 59752 t, whereas, for IP value 1 it estimated MSY as 41127 t. Moreover, sometimes GEA produced MF (minimization failure). MF is a condition when software does not compute parameters and give results because data pattern does not fit to that error assumption. Various parameters such as MSY, K, q etc. computed by CEDA for IP 1 are listed in Table II. MSY estimates of FM along with R2 value for NEA, LNEA and GEA are 41127 t (0.941), 44035 t (0.928) and 42978 t (0.934), respectively. Calculated values of CV and B by FM by using these error assumptions are 0.213 (311602 t), 0.189 (292692 t) and 0.193 (304644), in that order. MSY estimates along with R2 values of SM and PTM were same as 42543 t and 49222 t for NEA and LNEA. Computed value of B by these models was also same as 283171 t. Estimated values of CV for these models remained different in each error assumption. In these models, GEA produced MF.
ASPIC estimates
Table III lists various key parameters estimated by using ASPIC for IP 1. The estimates of MSY along with R2 values by FM and LM are 44680 t (0.956) and 51100 t (0.953), respectively. The calculated CV and BMSY values for these models were remained 0.163 (339500 t) and 0.224 (397300 t), in that order. On the other, for same models computed values of FMSY and K remained 0.131 (922900 t) and 0.128 (794600 t), correspondingly. Table IV shows various parameters computed through sensitivity analysis by using IP 0.5-1 in ASPIC. In both of the models, for smaller
Table II.- Various parameters computed by using CEDA for Spanish mackerel in Chinese marine waters (IP = 1).
|
Model |
K |
q |
r |
MSY |
CV |
R2 |
B |
|
FM (NEA) |
1004148 |
1.88E-07 |
0.111 |
41127 |
0.213 |
0.941 |
311602 |
|
FM ( LNEA) |
956238 |
2.01E-07 |
0.125 |
44035 |
0.189 |
0.928 |
292692 |
|
FM (GEA) |
979404 |
1.94E-07 |
0.119 |
42978 |
0.193 |
0.934 |
304644 |
|
SM (NEA) |
944558 |
2.01E-07 |
0.180 |
42543 |
0.258 |
0.939 |
283171 |
|
SM ( LNEA) |
845718 |
2.32E-07 |
0.232 |
49222 |
0.239 |
0.926 |
247654 |
|
SM (GEA) |
MF |
||||||
|
PTM (NEA) |
944558 |
2.01E-07 |
0.180 |
42543 |
0.232 |
0.939 |
283171 |
|
PTM (LNEA) |
845718 |
2.32E-07 |
0.232 |
49222 |
0.208 |
0.926 |
247654 |
|
PTM (GEA) |
MF |
MF, minimization failure; K, carrying capacity; q, catchability coefficient; r, intrinsic population growth rate; MSY, maximum sustainable yield; CV, coefficient of variation; R2, coefficient of determination; B, current biomass.
Table III.- Various parameters estimated by using ASPIC for Spanish mackerel in Chinese marine waters (IP = 1).
|
Model |
IP |
MSY |
K |
q |
FMSY |
BMSY |
R2 |
CV |
|
FM |
1 |
44680 |
922900 |
2.071E-07 |
0.1316 |
339500 |
0.956 |
0.163 |
|
LM |
1 |
51100 |
794600 |
2.444E-07 |
0.1286 |
397300 |
0.953 |
0.224 |
Table IV.- ASPIC results for Spanish mackerel by using ASPIC in Chinese marine waters (IP = 0.5-1).
|
Model |
IP |
MSY |
K |
q |
FMSY |
BMSY |
R2 |
CV |
|
FM |
0.5 |
63820 |
1158000 |
3.305E-07 |
0.1498 |
426000 |
0.953 |
0.115 |
|
0.6 |
57590 |
1079000 |
2.956E-07 |
0.1451 |
397000 |
0.954 |
0.134 |
|
|
0.7 |
52930 |
1025000 |
2.666E-07 |
0.1404 |
376900 |
0.954 |
0.142 |
|
|
0.8 |
49140 |
988300 |
2.414E-07 |
0.1352 |
363600 |
0.955 |
0.151 |
|
|
0.9 |
46750 |
949600 |
2.235E-07 |
0.1338 |
349400 |
0.955 |
0.163 |
|
|
1 |
44680 |
922900 |
2.071E-07 |
0.1316 |
339500 |
0.956 |
0.163 |
|
|
LM |
0.5 |
102000 |
603300 |
6.444E-07 |
0.3383 |
301700 |
0.944 |
0.089 |
|
0.6 |
84910 |
666500 |
4.847E-07 |
0.2548 |
333300 |
0.947 |
0.105 |
|
|
0.7 |
73280 |
703900 |
3.942E-07 |
0.2082 |
351900 |
0.949 |
0.136 |
|
|
0.8 |
64110 |
740400 |
3.280E-07 |
0.1732 |
370200 |
0.951 |
0.175 |
|
|
0.9 |
56940 |
769800 |
2.804E-07 |
0.1479 |
384900 |
0.952 |
0.175 |
|
|
1 |
51100 |
794600 |
2.444E-07 |
0.1286 |
397300 |
0.953 |
0.224 |
Table V.- ASPIC estimates of fishing mortality (F) and biomass (B) (IP = 1) (2006-2016).
|
Year |
Model |
|||||||
|
FM |
LM |
|||||||
|
F |
B |
F/FMSY |
B/BMSY |
F |
B |
F/FMSY |
B/BMSY |
|
|
2006 |
0.294 |
579000 |
1.963 |
1.359 |
0.573 |
301700 |
1.693 |
1.000 |
|
2007 |
0.293 |
485200 |
1.956 |
1.139 |
0.579 |
246700 |
1.712 |
0.817 |
|
2008 |
0.314 |
417100 |
2.097 |
0.979 |
0.629 |
210700 |
1.858 |
0.6986 |
|
2009 |
0.307 |
359100 |
2.051 |
0.843 |
0.624 |
178000 |
1.843 |
0.5901 |
|
2010 |
0.258 |
317800 |
1.724 |
0.745 |
0.514 |
155800 |
1.520 |
0.5164 |
|
2011 |
0.294 |
299300 |
1.962 |
0.702 |
0.562 |
154000 |
1.663 |
0.5106 |
|
2012 |
0.314 |
275000 |
2.095 |
0.645 |
0.584 |
145900 |
1.726 |
0.4838 |
|
2013 |
0.388 |
251000 |
2.591 |
0.589 |
0.728 |
136700 |
2.153 |
0.4531 |
|
2014 |
0.334 |
216500 |
2.228 |
0.508 |
0.644 |
112900 |
1.902 |
0.3744 |
|
2015 |
0.320 |
200600 |
2.136 |
0.470 |
0.622 |
103400 |
1.839 |
0.3428 |
|
2016 |
0.340 |
190200 |
2.269 |
0.446 |
0.675 |
97570 |
1.996 |
0.3235 |
IP values the MSY estimates are larger and vice versa. Such as, for IP 0.5, MSY estimate is 63820 t, whereas, for IP 1, MSY estimate is 44680 t in FM. Table V presents ASPIC estimates of F and B by using IP 1. For FM, results show that F has considerably increased from 2006 (0.294) to 2016 (0.340). In addition to this, B has decreased from 2006 (579000 t) to 2016 (1902000 t). Same trends, i.e., increase in F and decrease in B is observed for LM. These results clearly signpost that fishery stock of Spanish mackerel is swiftly declining because of overexploitation.
Discussion
Practical application and importance of non-equilibrium SPMs used in this study is confirmed by this phenomenon that many previous scientific studies conducted employ them (Memon et al., 2015; Panhwar and Liu, 2013). These models have the biggest advantage over the other statistical routines that these require simple catch statistics but compute very important fishery parameters which can be used to give fishery management advice (Mohsin et al., 2017). It is believed that non-equilibrium SPMs are trustworthy flexible statistical models which can be used to manage fishery stock. The biggest advantage of using these models relies in their assumption that they assume fishery in a non-equilibrium state. This assumption make them more reliable as compared to earlier versions of SPMs (Medley and Ninnes, 1997; Hoggarth et al., 2006). Like any other statistical model, these models also rely on certain other assumptions. These models assume that in the fish population interactions, intra as well as inter, does not occur. Similarly, these models assume that fishes does not leave or join the fish stock. Equally, catchability coefficient does not change with the passage of time, age composition is independent of growth rate, sampled fish stock is a single stock unit, catch statistics are true, natural mortality and fishing mortality occur at the same time, and efficiency of fishing vessels does not change (Hoggarth et al., 2006). In nature, some of these assumptions may not be met but still these models are powerful tools to estimate fishery stock upon which management can be made (Musick and Bonfil, 2005).
Findings of this study indicate that S. sinensis fishery resource is experiencing overexploitation. Such as declining trend in CPUE, as witnessed in this study, is a direct indicator of overexploitation. CPUE trend can predict ongoing fate of the fishery. Decreasing CPUE signpost declining fishery resource. Another reference point, that is actually the most commonly used indicator of fish stock, is MSY. The concept of this reference point was introduced in 1992. So far, this reference point has been used frequently to manage fishery stocks (Hoggarth et al., 2006). There are three conditions with respect to the estimated MSY. If the value of estimated MSY is higher than observed catch, in this condition more catch is feasible and fishery is assumed to be flourishing in this state. On the other hand, if the value of computed MSY is lower than observed catch statistics, in this condition the fishery resource is believed to be overexploited (Hoggarth et al., 2006). Our analysis shows that mostly the estimated values are much lower than the observed catch which means in the past S. sinensis fishery resource is overexploited. Moreover, increasing F and decreasing B also speak about the overexploitation of S. sinensis fishery resource in Shandong, China.
Fisheries management science is a complicated science which involves many steps from data gathering to analysis and finally implementation with the help of stakeholders (FAO, 1997; Die, 2002). In the process of fisheries management reference points have central importance. These were introduced in 1992 (FAO, 1995). Reference points are the figures estimated to manage fish stock. Based upon these figure management advice is given (Hoggarth et al., 2006). With respect to the management objective, reference points fall into two categories. First, target reference points are those reference points which are necessary to achieve in order to manage fishery resource. Second, limit reference points are those levels of harvest beyond which harvest will start to damage fishery resource (Caddy and Mahon, 1995; Cochrance, 2002). It is necessary to mention here that reference points are not fixed or constant figures rather they are just threshold levels. Therefore, reference points should be identified technically and properly otherwise the consequences may be undesirable. For instance, if MSY is not estimated properly the fishery stock will either overexploit or underexploit obviously. Moreover, it is better to set target reference points lower than the estimated MSY (Rosenberg et al., 1993).
Conclusion
MSY estimates by using CEDA and ASPIC computer packages overlapped significantly. Computed MSY range by the former software is between 41000-50000 t, whereas, for the later software this range is between 44000-52000 t. Thus, former software remained a bit conservative in MSY estimates as it computer lower MSY values as compared to later software. These estimated MSY values are lower than reported catch statistics of Spanish mackerel. It is also found that F has considerably increased and B has noticeably decreased during the study period. On the basis of these results, it is concluded that Spanish mackerel is exposed to the risk of overexploitation and the recommended harvest of this fishery resource is between 44000 t and 46000 t. However, further more in-depth studies are suggested before making any policies to conserve this fishery resource as this study is a preliminary study in this regard.
Acknowledgement
Authors are grateful to Wenzhou Business College for funding this study through the Foundation of Scientific Research for Inviting Talents (RC201910) and Zhejiang YueXiu University of Foreign Languages.
Statement of conflict of interest
Authors have no conflict of interest.
References
Alverson, D.L. and Paulik, G.J., 1973. Objectives and problems of managing aquatic living resources. J. Fish. Res. Bd. Can., 30: 1936-1947. https://doi.org/10.1139/f73-317
Caddy, J.F. and Mahon, R., 1995. Reference points for fisheries management. FAO Fisheries Technical Paper No. 347, FAO’s Fisheries Department, Rome, Italy, pp. 1-83.
China Fisheries Yearbook, 2017. China Statistical Press, Beijing.
Cochrane, K.L., 2002. The use of scientific information in the design of management strategies. Chapter 5, pp 95-130. In: A fishery manager’s guidebook: Management measures and their application (ed. K.L. Cochrane). FAO Fisheries Technical Paper No. 424, FAO’s Fisheries Department, Rome, Italy, pp. 1-231.
Collette, B., Chang, S.K., Di Natale, A., Fox, W., Juan Jorda, M., Nelson, R. and Uozumi, Y., 2011. Scomberomorus sinensis: The IUCN red list of threatened species 2011. International Union for Conservation of Nature, Gland, Switzerland. https://doi.org/10.2305/IUCN.UK.2011-2.RLTS.T170346A6760678.en
Collette, B., Chang, S.K., Di Natale, A., Fox, W., Juan Jorda, M., Nelson, R., Uozumi, Y. Collette, B.B. and Nauen, C.E., 1983. FAO species catalogue, Vol. 2. Scombrids of the world. An annotated and illustrated catalogue of tunas, mackerels, bonitos and related species known to date. FAO’s Fisheries Department, Rome, Italy, pp. 1-137.
Collette, B.B., 2001. Scombridae. Tunas (also, albacore, bonitos, mackerels, seerfishes, and wahoo). In: FAO species identification guide for fishery purposes (eds. K.E. Carpenter and V. Niem). The living marine resources of the Western Central Pacific, Vol. 6. Bony fishes part 4 (Labridae to Latimeriidae), estuarine crocodiles. FAO’s Fisheries Department, Rome, Italy, pp. 3721-3756.
Die, D., 2002. Design and implementation of management plans, Chapter 9, pp. 205-220. In: A fishery manager’s guidebook: Management measures and their application (ed. K.L. Cochrane). FAO Fisheries Technical Paper No. 424, FAO’s Fisheries Department, Rome, Italy, pp. 1-231.
FAO, 1995. Code of conduct for responsible fisheries. FAO’s Fisheries Department, Rome, Italy, pp. 41.
FAO, 1997. Fisheries management. FAO Technical Guidelines for Responsible Fisheries No. 4, FAO’s Fisheries Department, Rome, Italy, pp. 1-82.
FAO, 2018. The state of world fisheries and aquaculture 2018 - Meeting the sustainable development goals. FAO’s Fisheries Department, Rome, Italy, pp. 1-227.
FAO-FIES, 2018. Aquatic sciences and fisheries information system (ASFIS) species list. The Food Insecurity Experience Scale, FAO, Rome, Italy. Available at: htttps://www.fao.org/fishery/collection/asfis/en (accessed 11 August 2019).
FishBase, 2019. Scomberomorus sinensis (Lacepede, 1800). Chinese seerfish. Available at: https://www.fishbase.se/summary/137 (accessed 24 July 2019).
Fox, Jr. W.W., 1970. An exponential surplus-yield model for optimizing exploited fish populations. Trans. Am. Fish. Soc., 99: 80-88. https://doi.org/10.1577/1548-8659(1970)99<80:AESMFO>2.0.CO;2
Fricke, R., Eschmeyer, W.N. and Fong, J.D., 2019. Species by family/subfamily in the catalog of fishes. Institute for Biodiversity of Science and Sustainability, California Academy of Sciences. Available at: http://researcharchive.calacademy.org/research/ichthyology/catalog/SpeciesByFamily.asp#Scombridae (accessed 21 July 2019).
Frimodt, C., 1995. Multilingual illustrated guide to the world’s commercial warm water fish. Fishing News Books, Osney Mead, Oxford, England, pp. 215.
Herklots, G.A.C. and Lin, S.Y., 1940. Common marine food-fishes of Hong Kong. Hong Kong University, pp. 89.
Hoggarth, D.D., Abeyasekera, S., Arthur, R.I., Beddington, J.R., Burn, R.W., Halls, A.S., Kirkwood, G.P., McAllister, M., Medley, P., Mees, C.C., Parkes, G.B., Pilling, G.M., Wakeford, R.C. and Welcomme, R.L., 2006. Stock assessment for fishery management: A framework guide to the stock assessment tools of the fisheries management science program. FAO Fisheries Technical Paper No. 487, FAO’s Fisheries Department, Rome, Italy, pp. 1-261.
IGFA, 2009. Database of IGFA angling records until 2009. IGFA, Fort Lauderdale, USA.
Medley, P.A. and Ninnes, C.H., 1997. A recruitment index and population model for spiny lobster (Panulirus argus) using catch and effort data. Can. J. Fish. aquat. Sci., 54: 1414-1421. https://doi.org/10.1139/f97-027
Memon, A.M., Memon, K.H., Baloch, W.A., Memon, A. and Baset, A., 2015. Evaluation of the fishery status for King Soldier Bream Argyrops spinifer in Pakistan using the software CEDA and ASPIC. Chin. J. Oceanol. Limnol., 33: 966-973. https://doi.org/10.1007/s00343-015-4330-4
Mohsin, M., Mu, Y., Memon, A.M., Kalhoro, M.T. and Shah, S.B.H., 2017. Fishery stock assessment of Kiddi shrimp (Parapenaeopsis stylifera) in the Northern Arabian Sea Coast of Pakistan by using surplus production models. Chin. J. Oceanol. Limnol., 35: 936-946. https://doi.org/10.1007/s00343-017-6096-3
Mu, Y., Yu, H., Chen, J. and Zhu, Y., 2007. A qualitative appraisal of China’s efforts in fishing capacity management. J. Ocean Uni. China, 6: 1-11.
Musick, J.A. and Bonfil, R., 2005. Management techniques for elasmobranch fisheries. FAO Fisheries Technical Paper No. 474, FAO’s Fisheries Department, Rome, Italy, pp. 1-251.
Panhwar, S.K. and Liu, Q., 2013. Population statistics of the migratory hilsa shad, Tenualosa ilisha, in Sindh, Pakistan. J. appl. Ichthyol., 29: 1091-1096. https://doi.org/10.1111/jai.12134
Pella, J.J. and Tomlinson, P.K., 1969. A generalized stock production model. Inter-Am. Trop. Tuna Comm. Bull., 13: 416-497.
Prager, M.H., 2005. A stock-production model incorporating covariates (Version 5) and auxiliary programs. CCFHR (NOAA) Miami Laboratory Document MIA-92/93-55, Beaufort Laboratory Document BL-2004-01.
Rainboth, W.J., 1996. Fishes of the Cambodian Mekong. FAO species identification field guide for fishery purposes. FAO’s Fisheries Department, Rome, Italy, pp. 1-265.
Robins, C.R., Bailey, R.M., Bond, C.E., Brooker, J.R., Lachner, E.A., Lea, R.N. and Scott, W.B., 1991. World fishes important to North Americans. Exclusive of species from the continental waters of the United States and Canada. Am. Fish. Soc. Spec. Publ., 21: 243.
Rosenberg, A.A., Fogarty, M.J., Sissenwine, M.P., Beddington, J.R. and Shepherd, J.G., 1993. Achieving sustainable use of renewable resources. Science, 262: 828-829. https://doi.org/10.1126/science.262.5135.828
Schaefer, M.B., 1954. Some aspects of the dynamics of populations important to the management of the commercial marine fisheries. Inter-Am. Trop. Tuna Comm. Bull., 1: 23-56.
To share on other social networks, click on any share button. What are these?


