

An Experimental Model for Assessing the Storage Life of Chilled Chicken Meat Through Nir Spectroscopy


An Experimental Model for Assessing the Storage Life of Chilled Chicken Meat Through Nir Spectroscopy
Yar Muhammad Jalbani1,2*, Muhammad Farooque Hassan2, Kiran Nazish2 and Yang Shuming1
1Institute of Quality Standards and Testing Technology for Agro-Products, Chinese Academy of Agricultural Sciences, Beijing 100081 China
2Shaheed Benazir Bhutto University of Veterinary and Animal Sciences, Sakrand, SBA, Sindh, Pakistan
ABSTRACT
Meat is one of the susceptible commodities being spoiled even stored under refrigeration conditions. It is a challenging task to accurately estimate the storage life of chilled chicken meat to avoid economical losses and provide the basis for standard regulations assessing meat storage life. For analyzing the storage life of chilled chicken meat rapidly, the samples were analyzed on Day 0, 3, 5, 7 and Day 10 using near infra-red spectroscopy approach combined with chemometrics tool of data driven soft independent modeling of class analogy. The meat samples from day 0 were selected as target class and checked against other day samples. All the samples were accepted for training data set with 4 PCs while for test data set the constructed model accepted 100% samples and 100% rejection for other day samples. Three PCs were depicted for target class 3 and model accepted all the training samples, while for test set samples, the rejection ratio for Day 0, 3, 5, 7 and 10 was 100%, 0%, 100%, 100% and 100%. On the 5th day of storage the results were obtained with 4 PCs. The model accepted all the samples (100%) in training data set and for test samples rejection rate was 100%, 100%, 0%, 80% and 100% for Day 0, 3, 5, 7 and 10. Samples analyzed on 7th day of storage and 2 PCs showed good results. However, the model accepted all the training data samples and for test samples the rejection percentage for the Day 0, 3, 5, 7 and Day 10 was 80%, 100%, 90%, 0% and 100%. The samples analyzed on 10th day of storage were chosen as target class and results were best obtained by 3 PCs. Model accepted all the samples in training data set and for test data set the rejection percentage was 100%, 100%, 80%, 90%, and 0% for Day 0, 3, 5, 7 and Day 10 respectively. This study recognized NIR combined with chemometrics successfully discriminated the samples based on their storage days being practical tool for meat industry.
Article Information
Revised 21 December 2021
Accepted 19 January 2022
Available online 12 March 2022
(early access)
Published 15 December 2022
Authors’ Contribution
YMJ conducted the experiments and wrote the manuscript. MFH proofread the manuscript. KN performed data analysis. YS supervised the study.
Key words
Chilled chicken, Chemometrics, DD-SIMCA, NIR, Storage days
DOI: https://dx.doi.org/10.17582/journal.pjz/20211118041158
* Corresponding author: ym_jalbani@yahoo.com
0030-9923/2023/0002-555 $ 9.00/0
Copyright 2023 by the authors. Licensee Zoological Society of Pakistan.
This article is an open access article distributed under the terms and conditions of the Creative Commons Attribution (CC BY) license (https://creativecommons.org/licenses/by/4.0/).
Introduction
Poultry meat is one of the ever-growing food commodities almost all over the world because of its low production cost. Globally, about 127 million tons of poultry meat is produced per year, making it the biggest meat sector worldwide (FAO, 2020a). in comparison with other animal origin products such as beef, lamb or pork. Particularly low-fat content, high nutritional value and superior flavor makes poultry meat distinctive with ease of cooking and cultural acceptability are all key factors pushing the market development of chicken meat (FAO, 2020b; Katiyo et al., 2020; Russel et al., 1995). Therefore, its demand is ever-rising due to foremost concern of consumers about its quality and freshness. Meat freshness is key factor in sense of indicator for assessing meat quality and safety (Huang et al., 2008; Kamruzzaman et al., 2012). However, in China, consumers use to buy live chicken for their traditional eating habits with easy appraisal of the healthy chickens but recently, due to outbreaks of zoonotic diseases many live poultry markets have been closed. Hence, the consumer needs to be gradually adapted to chilled chicken meat, but it’s difficult to judge the quality of chilled chicken especially the freshness with their storage life.
Chicken meat a highly putrescible food that typically spoiled soon after slaughtering even stored in refrigerated conditions. Thus, its quality could be affected by biological agents, such as microorganisms and endogenous or microbial enzymes are of concern which ultimately spoil the meat and makes it unsuitable for human consumption. Consequently, there is an emergent stipulate for meat quality evaluation and control strategies. Hence, the trustworthy methods for promising evaluation of quality characteristics and freshness component in meat would benefit both end-users and the industry (Kuswandi et al., 2013). However, all the meat prior to be a part of markets must undergo quality controls for authenticating its quality for public health safety. Therefore, it is of great interest to accurately assess meat’s storage life in order to avoid possible threat for public health and to develop a strategic plan for regulations and controlling meat quality aspects.
Traditional analytical methods are typically destructive, time utilizing and needs procedures for sample preparations, therefore are not suitable for highly increasing, rapid and paced industrial meat sector (Alexandrakis et al., 2012). Therefore, in recent years spectroscopic techniques, received greater attention by researchers being simple, reliable, and often non-destructive in nature. The aptness of this technique combined with chemometric analysis for authenticating the foods in respect of adulterations has been studied (Downey, 1998; Reid et al., 2006; Zhang et al., 2011). Furthermore, NIR technology simultaneously analyzes different components and the possibility to extent its usage by optical fibers is key advantages of the technology (Huang et al., 2008; O’Brie et al., 2013; Siesler et al., 2002). Moreover, it could be a factual green science as it doesn’t use any chemicals and a little consumption of energy. However, the availability of such a technology could hold down the producers being avoid storing animal origin products for long period of time. In this context, we have focused on the application of NIR combined with DD-SIMCA for evaluating chilled chicken stored for different days.
Materials and Methods
A total of one hundred twenty five samples of fresh chicken meat were collected from the industry around Beijing city and transported to the laboratory of Institute of Quality Standards and Testing Technology for Agro Products, Chinese Academy of Agricultural Sciences, Beijing, maintaining the temperature of samples at 4°C. During transportation samples were placed in insulated boxes supplied with ice pads. All the samples were divided into 5 classes/batches (25 samples/ batch) in order to analyze on different days of storage. One batch was analyzed on day 0 of arrival, whereas the other 4 batches were subjected to refrigeration at 4±1°C and analyzed on the subsequent days of storage i.e. 3, 5, 7, and 10. The collected samples were scanned, 20 samples were used as a training data set from each class while 5 samples were used as alien objects to verify the efficiency of developed model for the same target class group.
NIR scanning
A total of 5 batches/classes were prepared for Near-infrared Spectroscopy (NIR) and analyzed on different days of storage. Briefly, the samples of chilled chicken meat (approx: 150 g for each sample) were separately grinded using home-based meat grinder. The spectra of samples were acquired at room temperature using NIR instrument (Buchi X-One spectrometer, Switzerland) in reflectance mode in range of 900-1700 nm with an increment of 5 nm wavelength. Spectrum from each sample was measured by placing it in a sample cup and two replicate spectra were obtained by changing the position of sample cup. Prior to spectral acquisition sample was pressed properly in a sample cup for removing any of the possible air particles that may influence spectra. Acquired spectrums from each sample were averaged before subjecting to data analysis. The whole spectral region was considered for analysis whereas all the spectral data was pre-processed (e.g. centered) before subjecting it for discriminate analysis.
Discrimination models (DD-SIMCA)
DD-SIMCA technique based on the principal component analysis (PCA) was employed to the training data set of target class. However, for SIMCA usage in excel, there is SIMCA template.xlsb a pattern for one class classification method. DD-SIMCA is sophisticated method for class modeling (Pomerantsev, 2008) which allows for calculating the errors of misclassification theoretically.
DD-SIMCA is one of the best options that efficiently applied for class modeling while it allows to calculate the misclassification errors theoretically. Furthermore, PCA is a key tool for class modeling that is subjected to the target class data matrix X and below decomposition is considered.

where T = (tia) denotes (I×A) scores matrix; P = (pja) is the (J×A) loadings matrix; E = (eij) is the (I×J) matrix of residuals; and A is the number of principal components (PC).
Whereas, in next step, for all object i = 1, I from the training set and two distances are calculated for each object and are score distance hi, and the orthogonal distance vi:
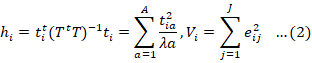
In this formula element hi = ∑ii=1 t2ia are the eigen values of matrix XtX arranged in descending order. Secondly, PCA results were employed for each sample i=1, I of the training set to calculate two relevant distances. These were calculated by following formula, and score distance (SD), hi, and the orthogonal distance (OD), vi:
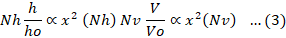
The sample position in the score pilot is represented by SD, and sample distance to the score pilot characterized as OD to the score space. Similar approach has been used as reported in a previous study (Pucherta et al., 2011) by developing a statistical evaluation tool for NIR images. Whereas, authors also correspond to score distances using Hotelling’s T2 values. In this study we followed features with some significant features that were mentioned above. A recent study (Pomerantsev, 2008) shown that distributions of both distances are well approximated by the scaled chi squared distribution where v0 and h0 are the scaling factors, Nh and Nv are the numbers of the degrees of freedom (DoF). These parameters are considered unknown and estimated using a data-driven method as explained in previous study (Pomerantsev and Rodionova, 2014).
Statistical total distance “c” calculated as,
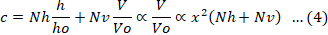
helps to develop the decision rules. An inequality is determined for decision rules (i.e. an acceptance area)

The first decision rule is developed for the given type I error α,

where χ -2 is the quantile of the chi-squared distribution with Nv+Nh DoF. To calculate the Type II error β, we should assume that an alternative class is available. Then
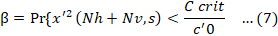
Where c crit is defined in Equation 5 and χ ‘2 is the noncentral chi-squared distribution. Parameters c’0 and S are found by the method explained in (Pomerantsev and Rodionova, 2014). In the developed acceptance area, every sample can be plotted in coordinate of SD against OD. By the application of theory in (Equations 6 and 7) to practice, we may yield two acceptance areas. In first, we developed a regular decision rule which is defined by a known α, and subsequently calculated β error.
Validation of the developed models against the unknown samples
For validation of the models, 24 refrigerated samples were collected from the supermarkets in Beijing to predict their storage days for the application and feasibility of NIR spectroscopy.
Results and Discussion
For a general chemometric approach we conducted two stage data processing. In first PCA model was settled keeping in view with the pertinent number of PCs. The number of PCs were selected in order to minimize the prediction errors. The aim of PCA modeling in SIMCA method is to describe the properties of observed class without stipulating discrete properties of objects or batches encompassed in the training set. A regular acceptance area from PCA model is developed by calculating the degrees of freedom for SD and OD with Equation 6.
Spectra interpretation and explorative analysis of chilled chicken meat
Figure 1 shows mean NIR spectra of the chilled chicken obtained after storage of different days. The full range spectra from 900 nm to 1700 nm from meat samples stored for different days shared the same absorbance pattern. Different absorbance values were observed for each chicken meat batches stored for different days, however, fresh chicken samples had higher absorbance values (lower reflectance) than other samples stored for different days. The concurrent increase of many dominant NIR bands arising from the overall vibrations, overtones and combination bonds in functional groups such as –H, N–H, C–H and S–H (Liu et al., 2001; Alamprese et al., 2013; Barbin et al., 2015). In general, the absorptions observed in the NIR region are overtones or combinations of the fundamental stretching bands which are usually due to C–H, N–H or O–H stretching mode (Cen and He, 2007). The distribution and magnitude of the main absorption bands observed in the present study agreed with those reported by Barbin et al. (2015) and Alexandrakis et al. (2012) referring to a wide region including the 900–2500 nm range of the applied instruments. which are attributed to water absorption, protein changes and the effect of bacterial spoilage metabolites corresponding to O–H, C–H, NH2 and CONH2 stretching and bending, first, second and third overtones, and combination bands (Liu et al., 2001; Alexandrakis et al., 2012; Barbin et al., 2015). During meat storage, a shift in absorbance bands may be induced by changes that occur in proteins, due to the action of oxidising enzymes promoting the formation of protein carbonyls, and in lipids, due to the evolution of oxidative reactions, resulting in the formation and release of secondary products including lipid alcohols, ketones, epoxides, aldehydes and hydrocarbons (Estevez, 2011). Previously similar trend has been reported for spectral characteristics of different pork quality grades for PSE, RFN and DFD samples (Douglas et al., 2012).
For the determination of variation among the samples stored for different days PCA was applied to the pre-processed spectral data to understand the differences between different day samples. Figure 2 demonstrating the score plot of samples stored at different days were well separated especially the samples from day 0 and day 10 depicting PC1-PC2. Meanwhile, the other samples from day 5 and 7 stated in the center of both groups behaving like properties of both groups and the samples from day 3 were located near to the day 0 i.e. the fresh samples. Apart from this study, Sinelli et al. (2010) conducted a study for predicting the shelf life of minced beef, they reported that samples between fresh and old, stored for 6–7 days, 2–3 days and 1 day at a temperature of 4.3 °C, 8.1 °C and at the highest temperature respectively. Based on their findings, the samples were well separated from each other discriminating between fresh and old ones. However, on the basis of quality characteristics such as normal, pale and dark chicken meat samples, (Barbin et al., 2015) found two clusters separating the normal meat from the pale and dark groups which is in consistent with this study that fresh samples behaved distinctly and can be differentiated from lower grade meat. In the other study reported by (Spanos et al., 2016) on the pork muscles for analyzing the effect of storage in modified atmospheric packing on longissimus thoracis et lumborum (LTL) and semi-membranous (SM) muscles, where they stated that LTL samples stored for 2 and 9 days were positioned separately, while on the contrary, samples having storage life of 6 days were located in between and partially overlapped with the samples of day 9. For SM, there was a slight overlapping in different classes. Grau et al. (2011) assessed the freshness in packaged sliced chicken breast and supports current study who discriminated the samples according to their storage life as 0, 7 and 14th day of storage using SW-NIR Spectroscopy.
DD-SIMCA procedure
The objectives of this study were the acquisition of spectral data and developing a target class for each day samples separately in order to discriminate them according to their storage life. Thus, we have five target classes of the samples which were analyzed on day 0, 3, 5, 7 and 10. Thus, keeping in view for samples from each day, the target model was developed and assessed in order to classify them according to their storage days. The external model validation is used for test samples from each of target class. For accessing the model specificity, the test samples from different classes are supposed to be aliens and whole calculations were performed on the pre-processed spectral data (e.g. centering and scaling) using chemometrics in excel. SIMCA procedure is a tool for developing an acceptance area from a known value of type I error, which facilitate for calculating the type II error for alternative classes. Thus, the subsequent estimation of sensitivity and specificity is also available.
In first, when the authentication model for day 0 was developed as the target class, PCA was applied to the training samples from day 0 which provides score and orthogonal distances (Equation 2), after that total distances were computed and developed by a cut-off level from known alpha-value. In order to analyze the test samples, the external validation is conducted for instance, the target samples from a batch. The efficiency of the model could be evaluated from the test samples of all classes they may considered as unknown objects. The meat samples from day 0 (on the day of arrival) were selected as target class and samples from other days which were stored at 4±1°C for different days were checked against the developed model. In Figure 3a the acceptance area was developed with four PCs. The decision rules were constructed using α=0.01. All the samples were found in acceptance region. However, for testing data set the acceptance percentage for day 0 samples was 100%, while 100% rejection percent was recorded for Day 3, Day 5, Day 7 and Day 10 with type II error β 0.976, 0.00, 0.00, 0.00 and 0.00 for all other classes as presented in Figure 3b. Due to non-acceptance, samples from all other days were located away from the acceptance area and were considered as alien objects. Meanwhile, the samples from day 0 were placed properly in acceptance range proving the efficiency of developed model as it could accurately classify the chilled chicken stored for different days.
The meat samples on 3rd day of storage were selected as target class and other samples were analyzed against the developed model. In order to construct the decision rules for the target class, the three PCs were depicted with α value as α=0.01. The model behaved with 100% acceptance for the training samples; hence the training set samples were located inside the discrimination line as presented in Figure 4a. While for test set Figure 4b the samples from other classes were placed far from the acceptance area that could be easily classified as aliens. The rejection ratio for Day 0, Day 3, Day 5, Day 7 and Day 10 was 100%, 0%, 100%, 100% and 100% with type II error β= 0.00, 1.00, 0.00, 0.00 and 0.00, respectively. Furthermore, all the test samples from target class were accurately situated in the acceptance area.
The samples analyzed on 5th day of storage were set as target class and the developed model was authenticated against other samples stored for different days. The results for acceptance and rejection percentage are presented in (Fig. 5a and b). The best results of target class were obtained using 4 PCs. The constructed model responded efficiently with accepting all the samples (100%) in training data set (Fig. 5a) which stated that all the samples located inside the discrimination line. As far test samples were concerned (Fig. 5b) from different days were positioned away from the region of acceptance and rejection rate was 100%, 100%, 0%, 80% and 100% for Day 0, Day 3, Day 5, Day 7 and Day 10 with type II error β= 0.000, 0.002, 0.998, 0.937 and 0.000, respectively. The samples were not accepted by the model are regarded as alien objects and were not found fit for the developed model which is evident for efficiency of the model.
Further samples were analyzed on the 7th day of storage (Fig. 6a and b). The 2 PCs played a vital role for this target day. However, the model accepted all the training data samples (Fig. 6a) i.e., all the training samples were placed in the acceptance area. On the contrary, almost all the testing samples were retained far away from acceptance area except two samples from day 0 and one sample from day 5 which were mistakenly accepted by the model (Fig. 6b) considering them as part of the developed model could be noted as false positive for developed model. Whereas the rejection percentage for the Day 0, Day 3, Day 5, Day 7 and Day 10 was 80%, 100%, 90%, 0% and 100% with type II error β=0.915, 0.002, 0.304, 0.989 and 0.004, respectively.
The samples stored for 10 days were chosen as target class, whereas other classes were analyzed against the developed model. Figure 7a representing the results for the target class 10 were best obtained by 3 PCs. The developed model for day 10 samples accepted all the samples in training data set (Fig. 7a), therefore all the samples were located within acceptance area. Similarly, samples from the test data set (Fig. 7b) were stored for different days accurately classified and were situated beyond the acceptance area except two samples from day 5 and one sample from day 7 which were accepted by the model considering them as false positive. The calculated rejection percentage was 100%, 100%, 80%, 90%, and 0% for Day 0, Day 3, Day 5, Day 7 and Day 10 with type II error β= 0.915, 0.002, 0.304, 0.989 and 0.004, respectively.
However, it is noteworthy that application of chemometrics based techniques has wide significance in food technology for exploring the complex data set. It is worth mentionable that (Jing et al., 2016) classified the foods based on their geological origin. Capuano et al. (2015) discriminated the thermal treated dairy products. In recent days, it is of great interest to discriminate the foods on the basis of storage life for consumer’s confidence as many of them are supposed to pay even more for fresh meat products.
Validation of the model against unknown samples
The samples collected from the supermarkets were tested for their storage days using NIR spectroscopy and were employed to developed SIMCA models to classify them according to their storage days. Based on developed models, the 18 (75%) samples were accurately classified as labelled on the package and accepted by the model developed for day 3, whereas, 1 (4.16%), 3 (12.5%), 2 (8.3%) samples were accepted by the models for day 0, day 3, day 7 and day 10. It is noteworthy that no sample was accepted for model developed against day 5. The samples used for the developing the models was stored at 4+1°C, however the collected samples from the supermarkets have different temperatures for storage that why the samples showed different absorption pattern and accepted by the different day models. In general, the superstore uses the freezing temperature i.e., -4 to -18, which ultimately decreases the absorption values when analyzed using the NIR spectroscopy, beside this the temperature changes among samples or even different storage temperatures have significant effect on the meat samples. The samples stored under freezing temperature have ability to reduce their proteolytic activity and ultimately the production of volatile nitrogen is also decreased as it is used for freshness indication.
Conclusions
NIR combined with DD-SIMCA was recognized as a suitable approach to monitor the chilled chicken stored for different days with rapid and low-cost method. However, DD-SIMCA revealed to be a practical tool for classifying the meat samples according to their storage days. Although the constructed model found reasonably accurate, recommending that the further studies should be carried out with large number of samples for industrial application.
Acknowledgement
Authors are highly grateful to Mr. Zhi (Buchi Instruments Switzerland) for his technical support for conducting this study.
This work was financially supported by IAEA Project No. D52040.
Author’s note
This study is a part of doctoral thesis of Yar Muhammad Jalbani.
Statement of conflict of interest
The authors have declared no conflict of interest.
REFERENCES
Alamprese, C., Casale, M., Sinelli, N., Lanteri, S. and Casiraghi, E., 2013. Detection of minced beef adulteration with turkey meat by UV-vis, NIR and MIR spectroscopy. LWT Fd. Sci. Technol., 53: 225–232. https://doi.org/10.1016/j.lwt.2013.01.027
Alexandrakis, D., Downey, G., and Scannell, A.G.M., 2012. Rapid non-destructive detection of spoilage of intact chicken breast muscle using near-infrared and Fourier transform mid-infrared spectroscopy and multivariate statistics. Fd. Biopro. Technol., 5: 338-347. https://doi.org/10.1007/s11947-009-0298-4
Barbin, D.F., Kaminishikawahara, C.M., Soares, A.L., Mizubuti, I.Y., Grespan, M., Shimokomaki, M., and Hirooka, E.Y., 2015. Prediction of chicken quality attributes by near infrared spectroscopy. Fd. Chem., 168: 554-560. https://doi.org/10.1016/j.foodchem.2014.07.101
Capuano, E., Gravink, R., Boerrigter-Eenling, R., and Ruth, S.M.V., 2015. Fatty acid and triglycerides profiling of retail organic, conventional and pasture milk: Implications for health and authenticity. Int. Dairy J., 42: 58-63. https://doi.org/10.1016/j.idairyj.2014.11.002
Cen, H.Y. and He, Y., 2007. Theory and application of near infrared reflectance spectroscopy in determination of food quality. Trends Fd. Sci. Technol., 18: 72–83. https://doi.org/10.1016/j.tifs.2006.09.003
Douglas, B., Gamal, E., Da-Wen, S., and Paul, A., 2012. Near-infrared hyperspectral imaging for grading and classification of pork. Meat Sci., 90: 259-268. https://doi.org/10.1016/j.meatsci.2011.07.011
Downey, G., 1998. Food and food ingredient authentication by mid-infrared spectroscopy and chemometrics. Trac. Trends Anal. Chem., 17: 418-424. https://doi.org/10.1016/S0165-9936(98)00042-9
Estevez, M., 2011. Protein carbonyls in meat systems: A review. Meat Sci., 89: 259–279. https://doi.org/10.1016/j.meatsci.2011.04.025
FAO, 2020a. The Food and Agriculture Organization, FAOSTAT [Online]. http://www.fao.org/faostat/en/#home. Accessed on June 10, 2020.
FAO, 2020b. The Food and Agriculture Organization. Gateway to poultry production and products. [Online]. http://www.fao.org/poultryproduction-products/en/. Access on June 10, 2020.
Grau, R., Sánchez, A.J., Girón, J., Iborra, E., Fuentes, A., Barat, J.M., 2011. Nondestructive assessment of freshness in packaged sliced chicken breasts using SW-NIR spectroscopy. Fd. Res. Int., 44: 331-337. https://doi.org/10.1016/j.foodres.2010.10.011
Huang, H., Yu, H., Xu, H., and Ying, Y., 2008. Near infrared spectroscopy for on/in-line monitoring of quality in foods and beverages: A review. J. Fd. Eng., 87: 303-313. https://doi.org/10.1016/j.jfoodeng.2007.12.022
Jing, Z., Xiaojing, D., Ni, C., Lanzhen, C., Xiaofeng, X., Jing, Z., and Wei, C., 2016. Identification of monofloral honeys using HPLC-ECD and chemometrics. Fd. Chem., 194: 167-174. https://doi.org/10.1016/j.foodchem.2015.08.010
Kamruzzaman, M., Elmasry, G., Sun, D.W., and Allen, P., 2012. Prediction of some quality attributes of lamb meat using near-infrared hyperspectral imaging and multivariate analysis. Anal. Chim. Acta, 714: 57-67. https://doi.org/10.1016/j.aca.2011.11.037
Katiyo, W., de Kock, H.L., Coorey, R. and Buys, E., 2020. Sensory implications of chicken meat spoilage in relation to microbial and physicochemical characteristics during refrigerated storage. LWT Fd. Sci. Technol., 128: 109468. https://doi.org/10.1016/j.lwt.2020.109468
Kuswandi, B., Jayus, Oktaviana, R., Abdullah, A., and Heng, L.Y., 2013. A novel on-package sticker sensor based on methyl red for real-time monitoring of broiler chicken cut freshness: A novel on-package sticker sensor based on methyl red. Packag. Technol. Sci., 27: 69-81. https://doi.org/10.1002/pts.2016
Liu, Y., Chen, Y.R., and Ozaki, Y.R., 2001. Two-dimensional visible/ nearinfrared correlation spectroscopy study of thermal treatment of chicken meats. Meat Sci., 54: 1458–1470. https://doi.org/10.1366/0003702001948600
O’Brie, N., Hulse, C., Pfeifer, F., and Siesler, H., 2013. Technical note: Near infrared spectroscopic authentication of seafood. J. Near Infrared Spect., 21: 299. https://doi.org/10.1255/jnirs.1063
Pomerantsev, A.L. and Rodionova, O.Y., 2014. On the type II error in SIMCA method. J. Chemom., 28: 518-522. https://doi.org/10.1002/cem.2610
Pomerantsev, A.L., 2008. Acceptance areas for multivariate classification derived by projection methods. J. Chemom., 22: 601-609. https://doi.org/10.1002/cem.1147
Pucherta, T., Lochmannb, D., Menezesc, J.C., and Reicha, G., 2011. A multivariate approach for the statistical evaluation of near-infrared chemical images using Symmetry Parameter Image Analysis (SPIA). Eur. J. Pharm. Biopharm., 78: 117-124. https://doi.org/10.1016/j.ejpb.2010.12.035
Reid, L.M., O’Donnell, C.P., and Downey, G., 2006. Recent technological advances for the determination of food authenticity. Trends Fd. Sci. Technol., 17: 344-353. https://doi.org/10.1016/j.tifs.2006.01.006
Russell, S.M., Fletcher, D.L., and Cox, N.A., 1995. Spoilage bacteria of fresh broiler chicken carcasses. Poult. Sci., 74: 2041-2047. https://doi.org/10.3382/ps.0742041
Siesler, H.W., Ozaki, Y., Kawata, S., and Heise, H.M., 2002. Near infrared spectroscopy: Principles, instruments, applications. https://doi.org/10.1002/9783527612666
Sinelli, N., Limbo, S., Torri, L., Egidio, V.D., and Casiraghi, E., 2010. Evaluation of freshness decay of minced beef stored in high-oxygen modified atmosphere packaged at different temperatures using NIR and MIR spectroscopy. Meat Sci., 86: 748-752. https://doi.org/10.1016/j.meatsci.2010.06.016
Spanos, D., Christensen, M., Tã¸Rngren, M.A., and Baron, C.P., 2016. Visible spectroscopy as a tool for the assessment of storage conditions of fresh pork packaged in modified atmosphere. Meat Sci., 113: 154-161. https://doi.org/10.1016/j.meatsci.2015.11.019
Tsenkova, R., Atanassova, S., Morita, H., Ikuta, K., Toyoda, K., Iordanova, I.K., and Hakogi, E., 2006. Near infrared spectra of cows’ milk for milk quality evaluation: Disease diagnosis and pathogen identification. J. Near Infrared Spectr., 14: 363-370. https://doi.org/10.1255/jnirs.661
Zhang, J., Zhang, X., Dediu, L., and Victor, C., 2011. Review of the current application of fingerprinting allowing detection of food adulteration and fraud in China. Fd. Contr., 22: 1126-1135. https://doi.org/10.1016/j.foodcont.2011.01.019
To share on other social networks, click on any share button. What are these?


