

A Hybrid Approach of Data Envelopment Analysis Based Grey Relational Analysis: A Study on Egg Yield


A Hybrid Approach of Data Envelopment Analysis Based Grey Relational Analysis: A Study on Egg Yield
Hande Küçükönder1, Pınar Çelebi Demirarslan1,*, Aykut Burgut2 and Mustafa Boğa3
1Faculty of Economics and Administrative Sciences, Bartın University, Ağdacı Campus 74000, Bartın, Turkey
2Faculty of Agriculture, Çukurova University, Yüreğir 01230, Adana, Turkey
3Bor Vocational School, Niğde University, Bor 51700, Niğde, Turkey
ABSTRACT
The aim of the study is to evaluate the effect of conditions of both feeding and the climate in poultry house on production performance in a commercial poultry enterprise with a hybrid approach. In accordance with this purpose, the hybrid approach has two main objectives: i) Determination of the effective period for which the output factors [(chicken survival rate (%), egg yield (%)] are optimized at the same time and the appropriate value ranges for the input factors [temperature (oC), humidity (%) and feed per hen (g)] that provide effectiveness ii) Determination of targeted improvement values for the ineffective months to become effective. With this hybrid approach, which is based on the integration of the Data Envelopment Analysis (DEA) and Grey Relational Analysis (GRA), the effective months are determined by DEA method and a performance rank is performed between the effective months by GRA method. It has been investigated whether the results of different Multicriteria Decision Making (MCDM) techniques combined with the data fusion technique support the proposed hybrid approach’s results. In this context, the proposed hybrid approach was applied to evaluate the monthly production performance of a commercial enterprise with Lohman Brown genus 8000 chickens. According to the findings of the analysis, it was seen that January, March, October, November and December are the months when production performance is high. When these months were ranked among themselves, it was observed that January, March and November are the first three ranks, respectively, and that the rank was also supported by the combined results of different techniques. As a result, in terms of production performance for the enterprise, it can be said that the optimum temperature is 20.25°C-26.41°C, humidity ratio is 47.60%-54.25%, and feed amount per hen is 98-128 g.
Article Information
Received 18 July 2018
Revised 30 August 2018
Accepted 09 October 2018
Available online 21 March 2019
Authors’ Contribution
HK designed and conducted the study. AB and MB collected and recorded the data. HK and PCD analyzed the data and wrote the manuscript. All authors helped to interpret results.
Key words
Laying hen, Temperature, Humidity, DEA, CRITIC, GRA.
DOI: http://dx.doi.org/10.17582/journal.pjz/2019.51.3.903.912
* Corresponding author: pdemirarslan@bartin.edu.tr
0030-9923/2019/0003-0903 $ 9.00/0
Copyright 2019 Zoological Society of Pakistan
Introductıon
Among the industrial sectors that are rapidly growing in our country, laying hen breeding has an important place. Today, the fact that the production is generally carried out in the poultry house in many sectorial enterprises makes it necessary to prepare the ideal environmental conditions to reduce the economic losses. Genotypes and environmental factors play an important role in the production of eggs at a desired level of quality for egg producer-enterprises (Sacakli, 2017). The common point of many of the studies is investigating the effect of these factors on egg production by parametric statistical methods (Gevrekçi and Takma, 2018; Takma et al., 2017; Duru and Şahin, 2015; Yıldız and Ceylan, 2015; Bayhan et al., 2013).
Parametric methods are known as powerful methods and require verification of certain fundamental assumptions (normality, variance homogeneity, sufficient sample size, etc.) in order to be used. In cases where parametric assumptions are not met, nonparametric methods can be usually preferred (Topal et al., 2016). In the literature, one of the non-parametric methods that are frequently used for efficiency and performance evaluation of enterprises is the DEA (Data Envelopment Analysis), which based linear programming. The main purpose of this method is based on the comparison of decision making units (DMU) for finding the best combination of inputs and outputs that will provide the operating efficiency of the enterprise (Silva et al., 2014). The DEA method has certain advantages such as the ability to analyze a model with multiple inputs and outputs, and the ability to use variables in different units together in the same model (Özden, 2016). This method is also used at many studies related to agriculture (Sivarajah, 2017; Reig-Martinez and Picazo-Tadeo, 2004) and used in evaluation of broiler farmings (Romero et al., 2010; Sefeedpari et al., 2012; Todsadee et al., 2012).
On the other hand, in recent years, it has been observed that another widely used analytical method in investigating enterprise performance is the Multicriteria Decision Making (MCDM) techniques (Ayaydın et al. 2017; Karaatlı, 2016; Ran and Wang, 2015; Jahan et al., 2012). MCDM is a method in which a large number of criteria that are generally conflicting with each other are evaluated simultaneously and the most appropriate one among the alternatives is determined (Karaatlı, 2016). There are many different analytical techniques in MCDM (CRITIC, TOPSIS, GRA, ARAS, MOORA, AHP etc.) and hybrid studies in the literature, in which these techniques are used alone, as well as integrated with different techniques (Tsaur et al., 2017; Markabi and Sabbagh, 2014; Pakkar, 2016; Girginer et al., 2015). Although the use of MCDM methods is still new in livestock science, there are some remarkable studies in the literature. Among these, the GRA was used in comparing some sensory characteristics of two different sheep breeds (Topal et al., 2016) and determining the most important variable affecting honey quality (Topal and Yağanoğlu, 2018), while the Fuzzy TOPSIS and AHP methods were used to perform accurate ranking of the growth in lambs from good towards bad (Özkan, 2013).
The aim of this study is to evaluate monthly egg production of a commercial poultry enterprise through the optimization of temperature, humidity and feed quantity which is effective in egg production by using a DEA-based GRA hybrid approach.
Materıals and methodology
Material
This study was carried out on 8000 pieces of Lohman Brown type chickens in a commercial poultry enterprise in the Çukurova region. These chickens, starting at 16 weeks of age, were followed up to 67 weeks of age, which took a year. Total number of chickens died during the production is 348. The daily feed quantity varied from 550 to 1000 kg during one year of experimentation. In this study, the records kept on a daily basis at the enterprise, concerning poultry house temperature (oC), humidity (%), feed quantity (kg), the number of eggs (pcs), the number of cracked eggs (pcs) and the number of dead chickens (pcs) were used. Among these, the monthly average values of poultry house temperature (oC), humidity (%), feed quantity (kg), the number of eggs (pcs), number of cracked eggs (pcs) are given in Figure 1, and the number of dead chickens (pcs) depending on monthly temperature and humidity change are given in Figure 2. In the graph in Figure 1, the primary axis on the y-axis shows the temperature, humidity and the number of cracked eggs, while the secondary axis shows the feed quantity and the number of eggs. In the graph in Figure 2, the primary axis on the y-axis shows the temperature while the secondary axis shows humidity.
Methodology
The steps of the proposed hybrid approach for evaluating the monthly egg yield of the enterprise are presented in Figure 3. The framework involves of three steps: The first step includes the determination of input and output variables, the second step involves the creation of the hybrid approach by synthesizing DEA-CRITIC-GRA methods, and the third step involves examining the validity of the hybrid approach with integrated MCDM methods (GRA, ARAS and MOORA- Reference Point).
The explanations of the implementation phases followed in the steps given below:
Phase 1: Determination of inputs and outputs
The data obtained from the enterprise records is arranged in the form of input and output in accordance with the DEA model structure. By processing the raw data, the input criteria are choosen as temperature (oC), humidity (%), feed quantity (g), while the output criteria are choosen as chicken survival rate (%) and egg yield (%).
Phase 2: Synthesis of DEA-CRITIC-GRA methods for the proposed hybrid approach
Step 1: DEA model for obtaining the efficiencies of months: The months when the enterprise was efficient in egg production were determined by the Slacks-Based Measure (SBM) model of the DEA method. This model emerged by improving the Additive Model by Ali, Lerme, Seiford and Thrall during 1995-1996 (Depren, 2008) and is based on the weighting the slacks. In this model, it is possible to determine simultaneously that how much the inputs should be reduced and how much the output should be increased, in both non-oriented and oriented situations. The basic form of the slacks-based model is obtained by linearization in the form of SBMt through defining a t-variable (Cooper et al., 2006; Tone, 2001).
Thesis: Let P be a set of production possibilities of n DMUs with positive input and output in the form of P= {(x, y) | x ≥ Xλ, λ ≥ 0}.
The input matrix shown as X = (xij) ϵ Rmxn and the output matrix shown as Y = (yij) ϵ Rsxn in a set. A DMU input is indicated as xo = Xλ + s–, while output is yo = Yλ – s+. Here, s– ϵ Rm, s+ ϵ Rs vectors show slack variables indicating input excess and output deficit, respectively, in the equations defined by xo and yo including s– ≥ 0 and s+ ≥ 0. The mathematical formulas of the non-oriented and input-oriented SBM model (Cooper et al., 2006) are given in Table I. The optimum solution for these models are in the form of ρ* = τ*, λ* = Λ* / t*, s–* = S–* / t*, s+* = S+* / t*. For optimal solution, it is stated that DMU is efficient when ρ*=1, while DMU is not efficient when ρ*≠1.
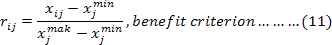
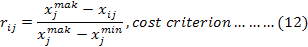
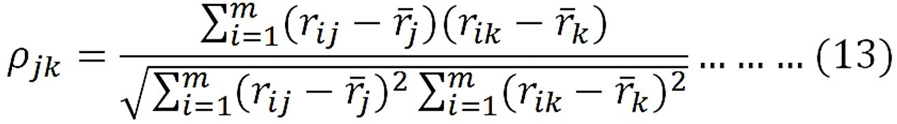
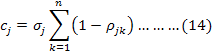
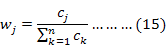
Step 2: Determination of weights of criteria using CRITIC method: In the objective function defined in Step 1, it is desirable to maximize both the egg yield and the poultry viability in for the same enterprise. Considering the relationship between these variables and temperature, humidity, feed quantity variables; each of these variables was defined as a criterion, and the CRITIC (Criteria Importance Through Intercritera Correlation) method was used to determine the significance weights of the criteria. The CRITIC method developed by Diakoulaki in 1995 is an objective weighting method in which standard deviation and inter-criterion correlation are used to calculate criterion weights (Yalçın and Ünlü, 2017; Diakoulaki et al., 1995). In the method, the decision matrix for m alternatives and n criteria is defined as D = [xij]mxn. This decision matrix used for the proposed hybrid approach was determined as DEA-based (Step 1). In the matrix, the values are indicated as i is the number of effective months (alternatives) in the DEA method, j is the number of criteria (all of the input and output variables) and xij is the projection value obtained with the SBM model for jth criterian in the ith month. The temperature, humidity and feed quantity criteria are taken as the cost criterion since the they have a negative effect on the production performance of chickens (Bayhan et al., 2013) and consequently there is a change in the utilization rates of the feed (Yıldız et al., 2013). In the application part of the method, Equality 11 and 12 are used for benefit and cost criteria, respectively. The relationship between the criteria is calculated by Spearman rank correlation by means of the formula in Equation 13. The significance weights of the criterion are calculated by Equation (14-15). In the equations, the values are indicated as follows i = 1, .... , m, j, k = 1, .... , n, ρjk: correlation between criteria, σjk: standard deviation of the jth criterion and wj the weight of the jth criterion (Yalçın and Ünlü, 2017).
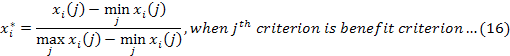
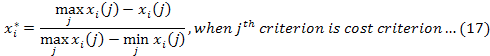
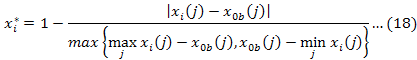
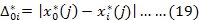
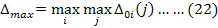
Step 3: Calculating the grey relational grades and obtaining the rank: In order to determine which is the most productive among the months concluded as efficient in Step 1, GRA method was used. This method is preferred for situations where there is uncertainty, insufficient knowledge, or complex inter-criteria relationships exist (Zhai et al., 2009; Hsu and Huang, 2006; Wu, 2002). In GRA method, the X0 reference series consists of a reference value for each criterion. In this proposed hybrid approach, the X0 reference series was created by calculating the average of input projection values and the maximum of the output projection values of DEA-based ineffective months. For the criterion weights, the values computed by CRITIC method determined in Step 2 were used. Hence, the months are ranked by hybrid approach of DEA-CRITIC-GRA. In the application of GRA method is integrated with the Step 1 and 2, a reference matrix is added to a decision matrix defined as D = [xij]mxn and transformed into X* = [x*ij](m+1)xn normalized matrix by normalization. Formulas in Equations 16-17 are used for the benefit and cost criteria and the formula in Equation 18 is used when the target optimal value is found in the jth criterion. In the method, by calculating the absolute value of the difference between x*0 and x*i, ∆*0i (j) matrix (i = 1, ... , m; j = 1, ... , n) is computed by using Equation 19 and a table for absolute values was created. Grey Relational Coefficient Matrix is obtained using Equation 20 to 22 (Wu, 2002).
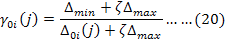

The ζ parameter in the equation is a distinguising coefficient (contrast control) and is range between [0,1]. This coefficient is used to adjust the difference between ∆0i and ∆max, and ζ = 1 indicates that it is at the highest level in terms of separability, while ζ = 0 indicates that there is no contradiction. If the data differences are too much, the ζ value can be chosen close to 0 in order to reduce the contrast. In literature, this value is usually taken as ζ = 0.5, for this study it was taken as ζ = 0.5, as well (Karaatlı, 2016; Topal et al., 2016). If the grey relational grade is high, it is assumed that the relationship between (x*0) reference series and the (x*i) series is strong, and if the grey relational grade value is 1, then these two series are the same. The grey relational level of the ith series is calculated by Equation 23 (Wu, 2002).
Phase 3: Examination of the validity of the hybrid approach
The validity of the ranking results obtained by the hybrid approach was analyzed by examining whether there was any change in the ranking when different MCDM techniques were used. For this purpose, ARAS, MOORA and GRA methods, having the similar purpose and structural properties among the MCDM methods, are used. The implementation steps for ARAS and MOORA methods are indicated in Supplementary Material. The reference set of the GRA method was differentiated at this stage and formed based on information in the literature [temperature: 21°C, humidity: 50% and feed quantity: 110 g] (Anonymous, 2007; Bayhan et al., 2013). In order for the ranking results of these methods to be evaluated more rationally, the rankings were scored by the Borda Count technique and integrated scores were obtained. In this method, the rankings are scored in the way that the last alternative is designated as “0 points” and the first alternative is designated as “(n-1) points” where n indicates the number of alternatives (Gök, 2015; Çakır and Perçin, 2013). The mathematical expression of the Borda score used in combining the scored rankings is as follows:
In the equation, B(i) is Borda score, Bik is indicates the rank of the ith class determined by the kth decision maker (Gök, 2015; Çakır and Perçin, 2013). In the analysis of the data, OSDEA-GUI program was used for DEA models, while the MS Excel program used for calculations of MCDM methods.
Results
The descriptive statistics of the input and output variables of the analyzed enterprise during 12 months are given in Table II.
Table II.- Descriptive statistics.
|
Variables |
n |
Min. |
Max. |
Mean±S.D. |
|
Input |
||||
|
Temperature (˚C) |
12 |
20.26 |
29.16 |
24.41±3.26 |
|
Humidity (%) |
12 |
47.60 |
75.58 |
58.22±9.79 |
|
Feed rate (g) |
12 |
98.34 |
137.97 |
120.20±14.40 |
|
Output |
||||
|
Egg rate (%) |
12 |
0.07 |
0.01 |
0.08±0.01 |
|
Viability (%) |
12 |
99.30 |
99.90 |
99.63±0.19 |
Table III.- Results of SBM model.
|
DMU |
Efficiency value |
Temperature projection value (°C) |
Humidity projection value (%) |
Feed rate projection value (g) |
Reference set |
|
January |
1 |
20.7690 |
52.3460 |
125 |
January |
|
February |
0.9341 |
21.7969 |
49.6186 |
110 |
March, November |
|
March |
1 |
22.2900 |
54.2580 |
128.4 |
March |
|
April |
0.9476 |
22.2611 |
53.8827 |
126.8 |
March, November |
|
May |
0.9710 |
22.2518 |
53.8740 |
126.8 |
March, November |
|
June |
0.7920 |
21.8124 |
50.3295 |
113.1 |
March, November |
|
July |
0.7508 |
21.7466 |
49.2234 |
108.5 |
March, November |
|
August |
0.7474 |
21.2349 |
48.2573 |
101.6 |
November, December |
|
September |
0.8347 |
21.0977 |
48.8723 |
101.3 |
November, December |
|
October |
1 |
26.4190 |
52.5160 |
104.3 |
October |
|
November |
1 |
21.5000 |
47.6000 |
102.5 |
November |
|
December |
1 |
20.2580 |
50.0320 |
98.3 |
December |
The results, which are used to determine the monthly production efficiency of the enterprise, obtained according to the SBM-Input Oriented model are given in Table III consisting efficiency scores, the projection (improvement) values required for the inputs and the reference cluster information.
According to Table III, the enterprise was found to be effective in egg production in the months of January, March, October, November and December. When the projection values of these months are examined, the ranges providing the maximum egg yield and viability are found to be 20.25°C - 26.41°C for the lowest and highest temperature, 47.60% - 54.25% for the humidity, and 98g - 128g for feed rate per chicken.
On the other hand, the months with the lowest efficiency value were determined to be June, July and August. In addition, February, April and May can be considered as effective months, since the months’ efficiency scores are very close to 1. When the projection values for these months are examined, it was observed that the reference set contains mostly the months of March and November. In the months, in which efficiency scores are below 1 (Table III), the amount of improvement to be made for temperature, humidity and feed quantity per chicken are given in Figures 3, 4 and 5; respectively. Accordingly, it can be seen that the ambient temperature can be optimum when the highest reduction is made for the value of the poultry house temperature in August (7.92 °C), while the lowest reduction is made in February (0.44°C) (Fig. 4). It can be seen that the amount of humidity can be at an optimum level when the highest reduction is made in August (26.93%) and the lowest reduction is made in May (0.67%) (Fig. 5), while the feed quantity per chicken can be at an optimum level when the highest reduction is made in June (36 g) and the lowest reduction is made in September (4 g) (Fig. 6).
Table IV.- Ranking results of CRITIC-based GRA method.
|
Weighted Grey Relational Coefficient Matrix* |
|||||||
|
Temp. (°C) |
Humidity (%) |
Feed rate (%) |
No. of eggs (pcs) |
Viability (%) |
|||
|
Wj |
0.1575 |
0.1793 |
0.2353 |
0.2219 |
0.2061 |
Grey Relational Degree |
GRA Rank |
|
X0 |
21.743 |
50.580 |
112.610 |
0.0950 |
99.897 |
||
|
January |
0.1112 |
0.0915 |
0.0914 |
0.1188 |
0.1997 |
0.6126 |
1 |
|
March |
0.1276 |
0.0598 |
0.0784 |
0.2073 |
0.1149 |
0.5879 |
2 |
|
October |
0.0525 |
0.0873 |
0.1145 |
0.1182 |
0.1033 |
0.4759 |
4 |
|
November |
0.1426 |
0.0684 |
0.1029 |
0.1040 |
0.0687 |
0.4866 |
3 |
|
December |
0.0963 |
0.1382 |
0.0837 |
0.0740 |
0.0813 |
0.4734 |
5 |
* Weighted grey relational coefficients were obtained by multiplying the grey relational coefficients and the weights wj obtained as a result of the CRITIC method. ∆min = 0, ∆max = 1 and ζ = 0.5 in GRA calculation. X0, reference set.
Table V.- Borda count method results.
|
MCDM method |
Months |
|||||||||||
|
M1 |
M2 |
M3 |
M4 |
M5 |
M6 |
M7 |
M8 |
M9 |
M10 |
M11 |
M12 |
|
|
GRA score |
11 |
8 |
10 |
7 |
9 |
0 |
2 |
1 |
5 |
4 |
6 |
3 |
|
ARAS score |
10 |
7 |
8 |
4 |
6 |
1 |
0 |
2 |
3 |
5 |
9 |
11 |
|
MOORA score |
10 |
9 |
8 |
5 |
7 |
3 |
0 |
1 |
2 |
4 |
11 |
6 |
|
BORDA score |
31 |
24 |
26 |
16 |
22 |
4 |
2 |
4 |
10 |
13 |
26 |
20 |
|
Rank |
1 |
4 |
2 |
7 |
5 |
10 |
12 |
10 |
9 |
8 |
2 |
6 |
|
Hybrid rank: M1>M3>M11>M10>M12 |
Borda rank: M1>M3 ~ M11>M12>M10 |
|||||||||||
M1, January; M2, February; M3, March; M4, April; M5, May; M6, June; M7, July; M8, August; M9, September; M10, October; M11, November; M12, December.
Within 5 months that the enterprise is efficient, the most productive month has been determined via CRITIC-based GRA method, and the results are given in Table IV. According to Table IV, January is the first, while March and November are the 2nd and 3rd, respectively and December was the last month. If the GRA ranking results, DEA efficiency values and reference points are considered together, it is seen that the months of January, March and November are the most productive months.
After the ranking results obtained by the hybrid approach are analyzed, different MCDM methods were used to show how the ranking results change depending on the method. For this purpose, the reference serie of the methods used in the analysis is defined as X0 = (21, 50, 110, 0.096, 99.897) for the GRA, MOORA Reference Point method and ARAS method (for more information about MOORA and ARAS method, see Supplementary Material). The ranking results of the months according to these methods are given in Figure 7.
In the graph in Figure 7, it was seen that the ranking results of each method were very different from each other. Since this makes decision making difficult, the ranking results were combined with the Borda Count technique given in Table V. When the ranking results of the hybrid approach with the Borda method were compared (Table IV), it was observed that the first three months are the same. Therefore, it was seen that the ranking results of the different MCDM methods combined with Borda Count technique support the results of proposed hybrid approach.
Discussion
According to the results of the hybrid approach obtained with the DEA-based CRITIC and GRA, it was determined that poultry house temperature, humidity and feed quantity of the enterprise was optimum, while egg yield and viability of chickens was the maximum in the months of January, March, October, November and December (Table III). This shows that the enterprise is more effective in egg production in the months of winter and transition months compared to the summer months. Poultry house temperature values for winter months (20.26°C-21.80°C) is higher than the value (16°C) reported by Kılıç and Şimşek (2008), and is around the upper bound of the value (10.5°C-20.9°C) reported by Karaman et al. (2005). In their study, Bulancak and Baylan (2015) expressed that the thermoneutral temperature value for a mature chicken is between 15°C - 25°C. In another study, it is noted that when the ambient temperature exceeded 28°C, chickens underwent temperature stress, and thus egg yield and quality decrease (Uğurlu and Kara, 2000; Motiang, 2013). Additionally, it is stated in the literature that the optimum ambient temperature is between 11°C-21°C for egg yield (Motiang, 2013; Bayhan et al., 2013). In accordance with these reported information, it can be said that the chickens do not experience heat stress during the period when the enterprise is efficient and thereby the mortality rate is minimized and the egg yield is maximized. In this study, the monthly temperature values during the transition period (21.1°C-26.42°C) are found higher than the value (18°C) stated by Kılıç and Şimşek (2008).
The humidity rates during the months when the enterprise is efficient were found at least 47.6% and at most 54.52%. For the optimum humidity rate, Bayhan et al. (2013) expressed that the value should be 50%, Bulancak and Baylan (2015) said that the value should be between 60% -70%, while Motiang (2013) mentioned that the value should not be above 75%. The humidity rates in the current study comply with this information and were found lower than the values (56.91%-78.86%) reported by Karaman et al. (2005) and the value (60-70%) given by Bulancak and Baylan (2015).
When all inputs and outputs of the enterprise were evaluated together, it was found that the months of June-July-August and September had the lowest efficiency score (Table III). Accordingly, in the current study, it was observed that the lowest temperature value of the summer months was 26.2°C, while the highest temperature value was 29.2°C, which is lower than the value of 31°C reported by Kılıç and Şimşek (2008). The humidity rates of 69.26%-75.20% during the summer months was higher than the values of 65% reported by Uğurlu et al. (2002). These differences are thought to be due to the fact that the commercial enterprise is located in Çukurova Region and the effects of climatic factors. In addition to these findings in the study, it was seen that egg production will also increase when the projection values for the poultry house temperature, humidity and feed rate per poultry are adjusted according to the months in the reference sets. It was observed that the reference point for the ineffective months in the reference set is usually March and November (Table III). The feed quantity per chicken in these months was found 102 g and 128 g, respectively (Table III). In our country conditions, it was reported that this value varies between 120-130 g (Anonymous, 2018) and 110-125 g (Anonymous, 2017). Findings in the current study are consistent with the ones reported previously in the literature, while the values found higher than the value of 115 g given by Saçaklı (2017) and was found lower in the month of November.
As a result, it can be concluded that the temperature range is 20.25°C-26.41°C, the humidity rate range is 47.60%-54.25%, and the feed rate per chicken is 98-128 g, providing the best egg yield based on the proposed hybrid approach. Furthermore, when a ranking is made for months in which the egg yield is high, the first three are January, March and November, respectively (Table IV). When these ranking results are examined with different MCDM methods, it is seen the first three months were in the same rank (Table IV), which indicates that the Borda Rank results support the hybrid approach results.
Conclusıon
It can be concluded that the projection values can be taken as a reference points in cases where information is lacking in the literature. Additionally, more detailed results can be obtained when the DEA models are integrated with the MCDM models in the data set where there is interaction among the criteria. Further studies can be used to expand the data set by using different weighting or decision-making methods and to see how the results change when other factors affecting egg production are included in the analyze. By using different weighting or decision-making methods in future studies, the results can be observed when the data set can be expanded and the other factors affecting egg production are included in the model.
There is supplementary material associated with this article. Access the material online at: http://dx.doi.org/10.17582/journal.pjz/2019.51.3.903.912
Statement of conflict of ınterest
Authors have declared no conflict of interest.
References
Anonymous, 2007a. T.C. Laying Hens. Republic of Turkey. Ministry of Agriculture and Foresty. Available at: http://www.tarim.gov.tr/HAYGEM/Belgeler/Hayvanc%C4%B1l%C4%B1k/Kanatl%C4%B1%20Yeti%C5%9Ftiricili%C4%9Fi/YumurtaTavukculugu.pdf (accessed 18 March 2018).
Anonymous, 2018. Laying hens. Ministry of Agriculture and Foresty: İstanbul Directorate of Provincial Agriculture and Foresty. Available at: https://istanbul.tarim.gov.tr/Belgeler/KutuMenu/Brosurler/Hayvancilik/yumurtatavuk.pdf (accessed 18 March 2018).
Ayaydın, H., Durmuş, S. and Pala, F., 2017. Performance on measurement in Turkish logistics ındustry with grade relative analysis method. Gümüşhane Univ. Elect. J. Inst. Soc. Sci., 8: 76-94.
Bayhan, A.K., Karaman, S. and Koşkan, Ö., 2013. Effects of heat stress on egg yield and mortality rates of caged poultry houses. J. Facul. Vet. Med. Kafkas Univ., 19: 881-887.
Brauers, W.K. and Zavadskas, E.K., 2006. The MOORA method and its application to privatization in a transition economy. Contr. Cybernet., 35: 445-469.
Bulancak, A. and Baylan, M., 2015. Negative Impacts of the high temperature-humidity in poultry and precautions. J. Anim. Prod., 56: 58-69.
Cooper, W.W., Seiford, L.M. and Tone, K., 2006. Introduction to data envelopment analysis and ıts uses with DEA-solver software and references. Springer, USA.
Çakır, S. and Perçin, S., 2013. Performance measurement of logistics firms with multi-criteria decision making methods. Ege Acad. Rev., 13: 449-459.
Depren, Ö., 2008. Data envelopment analysis and an application. Unpublished Master thesis, Yıldız Technical University Grad School of Natural and Applied Sciences, İstanbul, Turkey.
Diakoulaki, D., Mavrotas, G. And Papayannakis, L., 1995. Determining objective weights in multiple criteria problems: The critic method. Comput. Operat. Res., 22: 763-770. https://doi.org/10.1016/0305-0548(94)00059-H
Duru, M. and Şahin, A., 2015. Effects of dietary ferula eleaochytris powder on yield and egg quality in laying hens. Iğdır Univ. J. Inst. Sci. Technol., 5: 99-109.
Gevrekci, Y. and Takma, C., 2018. A comparative study for egg production in layers by decision tree analysis. Pakistan J. Zool., 50: 437-437.
Girginer, N., Köse, T. and Uçkun, N., 2015. Efficiency analysis of surgical services by combined use of data envelopment analysis and gray relational analysis. J. med. Syst., 39: 56. https://doi.org/10.1007/s10916-015-0238-y
Gök, M., 2015. Ranking g20 countries with regard to energy indicators via multiple criteria decision making techniques. Unpublished Master thesis, Ankara University Graduate School of Social Sciences, Ankara, Turkey.
Hsu, C.J. and Huang, C.Y., 2006. Comparison and assessment of ımproved grey relation analysis for software development effort estimation. IEEE International Conference on Management of Innovation and Technology, pp. 663-667.
Jahan, A., Mustapha, F., Sapuan, S.M. and Ismail, M.Y., 2012. A framework for weighting of criteria in ranking stage of material selection process. Int. J. Adv. Manufact. Technol., 58: 411-420.
Karaatlı, M., 2016. An ıntegrated entropy-gray relational analysis approach: A study on tourism ındustry. Suleyman Demirel Univ. J. Facul. Econ. Admin. Sci., 21: 63-77.
Karaman, S., Ergüneş, G. and Turhan, S., 2005. The status and development possibilities of strructural and environmental conditions of caged houses in Tokat area. J. Agric. Facul. Gaziosmanpasa Univ., 22: 67-76.
Kılıç, İ. and Şimşek, E., 2008. A study on determination of sufficiency of ındoor environmental conditions in a layer house with deep-pit. J. Agric. Facul. Uludag Univ., 22: 17-29.
Markabi, M.S. and Sabbagh, M., 2014. A hybrid method of GRA and DEA for evaluating and selecting efficient suppliers plus a novel ranking method for grey numbers. J. indust. Engin. Manage., 7: 1197-1221.
Motiang, I.B., 2013. Evaluation of different chicken layer breeds for use in integrated aquaculture-poultry production systems in Gauteng, South Africa. Unpublished Master’s thesis, Faculty of Natural and Agricultural Sciences, University of Pretoria, Pretoria, South Africa.
Özden, A., 2016. Performance level determination of dairy farms using dea. Turkish J. agric. Econ., 22: 49-55.
Özkan, G., 2013. An aplication in the field of animal breeding in order to compare fuzzy TOPSIS and AHP methods. Master thesis, Afyon Kocatepe University Institue of Natural and Applied Sciences, Afyon, Turkey.
Pakkar, S.M., 2016. An integrated approach to grey relational analysis, analytic hierarchy process and data envelopment analysis. Busi. Econ. Res. J., 9: 71-86. https://doi.org/10.1108/JCC-08-2016-0005
Ran, R. and Wang, B.J., 2015. Combining grey relational analysis and TOPSIS concepts for evaluating the technical innovation capability of high technology enterprises with fuzzy information. J. Intell. Fuzz. Syst., 29: 1301-1309.
Reig-Martinez, E. and Picazo-Tadeo, A.J., 2004. Analyzing farming systems with data envelopment analysis: Citrus farming in Spain. Agric. Syst., 82: 17-30. https://doi.org/10.1016/j.agsy.2003.12.002
Romero, L.F., Zuidhof, M.J., Jeffrey, S.R., Naeima, A., Renema, R.A. and Robinson, F.E., 2010. A data envelope analysis to assess factors affecting technical and economic efficiency of ındividual broiler breeder hens. Poult. Sci., 89: 1769-1777. https://doi.org/10.3382/ps.2009-00391
Saçaklı, P., 2017. Ankara University open course materials. Available at: https://acikders.ankara.edu.tr/pluginfile.php/11130/mod_resource/content/1/TAVUK-BESLEME-PINAR-SACAKLI.pdf (accessed 18 March 2018).
Sefeedpari, P., Rafiee, S. and Akram, A., 2012. Selecting energy efficient poultry egg producers: A fuzzy data envelopment analysis approach. Int. J. appl. Operat. Res., 2: 77-88.
Silva, D.A., Alves, G.I., Mattos-Neto, P.S. and Ferreira, T.A., 2014. Measurement of fitness function efficiency using data envelopment analysis. Exp. Syst. Appl., 41: 7147-7160. https://doi.org/10.1016/j.eswa.2014.06.001
Sivarajah, P., 2017. Farm efficiency measurement of paddy production in Northern Sri Lanka using data envelopment analysis (DEA) approach. Int. J. Res. Granthaalayah, 5: 164-170.
Şimşek, A., Çatır, O. and Ömürbek, N., 2015. Vendor choice with TOPSIS and MOORA methods: A practice in tourism sector. J. Soc. Sci. Inst., 18: 133-161.
Takma, Ç., Gevrekçi, Y., Özsoy, A.N. and Çevik, M., 2017. Canonical correlation analysis on egg production traits of quails. Süleyman Demirel Üniv. Ziraat Fakül. Derg., 12: 92-99.
Todsadee, A., Kameyama, H., Ngamsomsuk, K. and Yamauchi, K., 2012. Production efficiency of broiler farming in Thailand: A stochastic frontier approach. J. agric. Sci., 4: 221-231.
Tone, K., 2001. A slacks-based measure of efficiency in data envelopment analysis. Eur. J. Operat. Res., 130: 498-509. https://doi.org/10.1016/S0377-2217(99)00407-5
Topal, M. and Yağanoğlu, A.M., 2018. Comparison of quality characteristics ın honey using grey relational and principal component analysis methods. J. Anim. Pl. Sci., 28: 264-269.
Topal, M., Özdemir, M., Yaganoglu, A.M. and Esenbuga, N., 2016. Comparison of the sensory characteristics ın Awassi and Red Karaman sheep with the grey relational analysis method. J. Anim. Pl. Sci., 26: 63-68.
Tsaur, R.C., Chen, I. and Chan, Y.S., 2017. TFT-LCD industry performance analysis and evaluation using GRA and DEA models. Int. J. Prod. Res., 55: 4378-4391. https://doi.org/10.1080/00207543.2016.1252863
Uğurlu, N. and Kara, M., 2000. The cooling performance of wet pads and their effect on reduction of the ınside temperature. Turkish J. Agric. Forest., 24: 79-86.
Uğurlu, N. and Kara, M., 2002. The effects of stocking density and thermal conductivity on ventilatıon rate of laying hens. J. Selçuk Univ. Agric. Facul., 16: 59-64.
Wu, H.H., 2002. A comparative study of using grey relational analysis in multiple attribute decision making problems. Qual. Engineer., 15: 209-217. https://doi.org/10.1081/QEN-120015853
Yalçın, N. and Ünlü, U., 2017. A multi-criteria performance analysis of ınitial public offering (IPO) firms using CRITIC and VIKOR methods. Technol. econ. Develop. Econ., 24: 534-560. https://doi.org/10.3846/20294913.2016.1213201
Yıldız, A., Laçin, E., Esenbuğa, N., Kocaman, B. And Macit, M., 2013. Effect of tier level on the performance and egg quality traits of laying hens in different seasons. Atatürk Univ. J. Vet. Sci., 8: 145-152.
Yıldız, T. and Ceylan, N., 2015. The effect of using gamma ırradiated wheat and barley in layer diets on egg product parameters quality. Turkish J. Agric. Fd. Sci. Technol., 3: 742-747. https://doi.org/10.24925/turjaf.v3i9.742-747.456
Zavadskas, E.K. and Turskis, Z., 2010. A new additive ratio assessment (ARAS) method in multicriteria decision-making. Technol. Econ. Develop. Economy, 16: 159-172.
Zhai, L.Y., Khoo, L.P. and Zhong, Z.W., 2009. Design concept evaluation in product development using rough sets and grey relation analysis. Exp. Syst. Appl., 36: 7072-7079.
To share on other social networks, click on any share button. What are these?


